The median home sale price rose to a record high, while the number of homes for sale fell to an all-time low, according to a new report from Redfin, the technology-powered real estate brokerage.
There are some signs that homebuying may be returning to a more typical seasonal trend as the share of homes sold in one week fell after Thanksgiving more than it has since early September. Pending home sales fell to their lowest level since February.
“Homebuying demand seems to be returning to a slowdown trend that we’d typically expect to see in the last few weeks of the year,” said Redfin Chief Economist Daryl Fairweather. “The latest research on the Omicron variant seems to be easing consumers’ worst fears, but a lot of uncertainty remains in the economy—from inflation, jobs and wages to how the Fed reacts to those factors. Amid all that economic uncertainty, the notion that home prices will continue to grow in the nearterm feels relatively certain.”
Key housing market takeaways for 400+ U.S. metro areas:
Unless otherwise noted, this data covers the four-week period ending December 5. Redfin’s housing market data goes back through 2012.
- The median home-sale price hit a new all-time high of $360,250, up 14% year over year. This was up 30% from the same period in 2019.
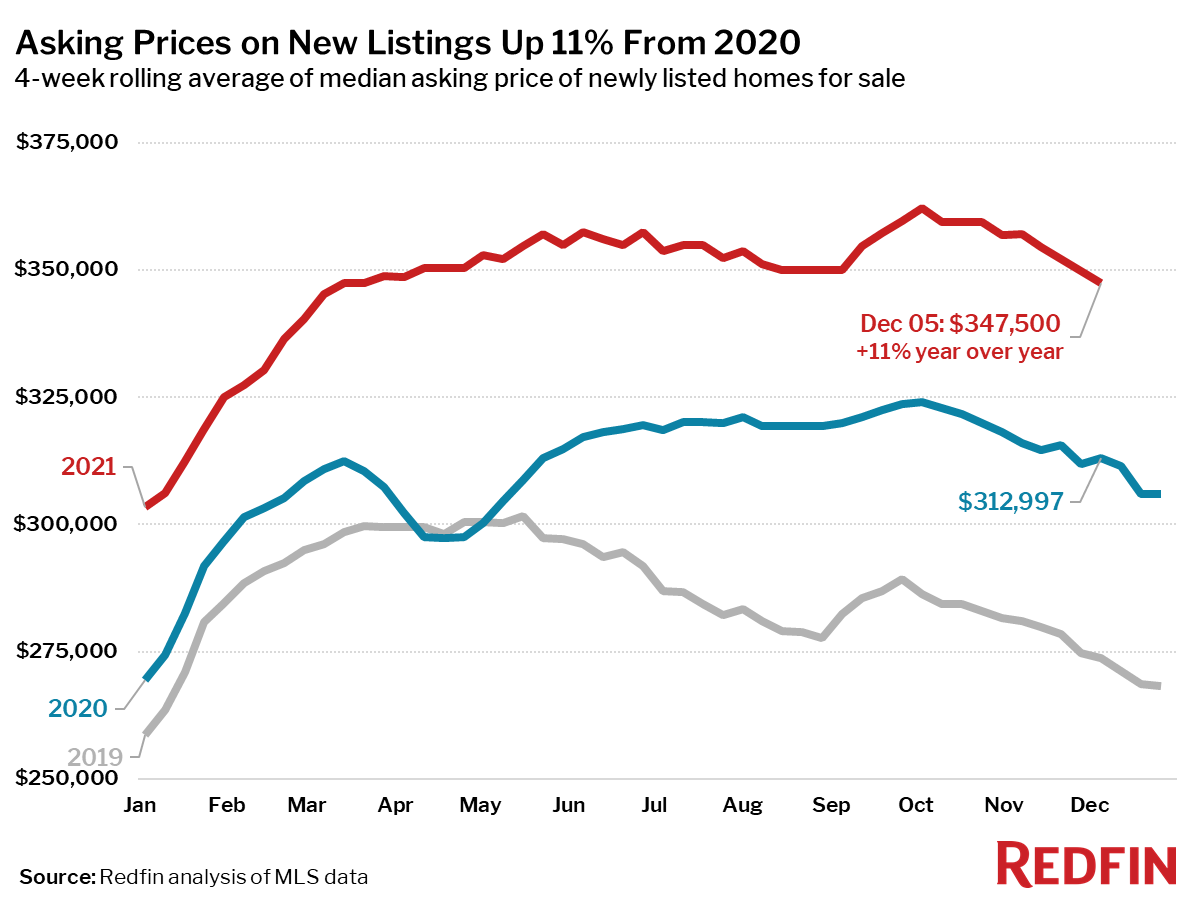
- Asking prices of newly listed homes were up 11% from the same time a year ago and up 27% from 2019 to a median of $347,500.
- Pending home sales were up 5% year over year, and up 49% compared to the same period in 2019.
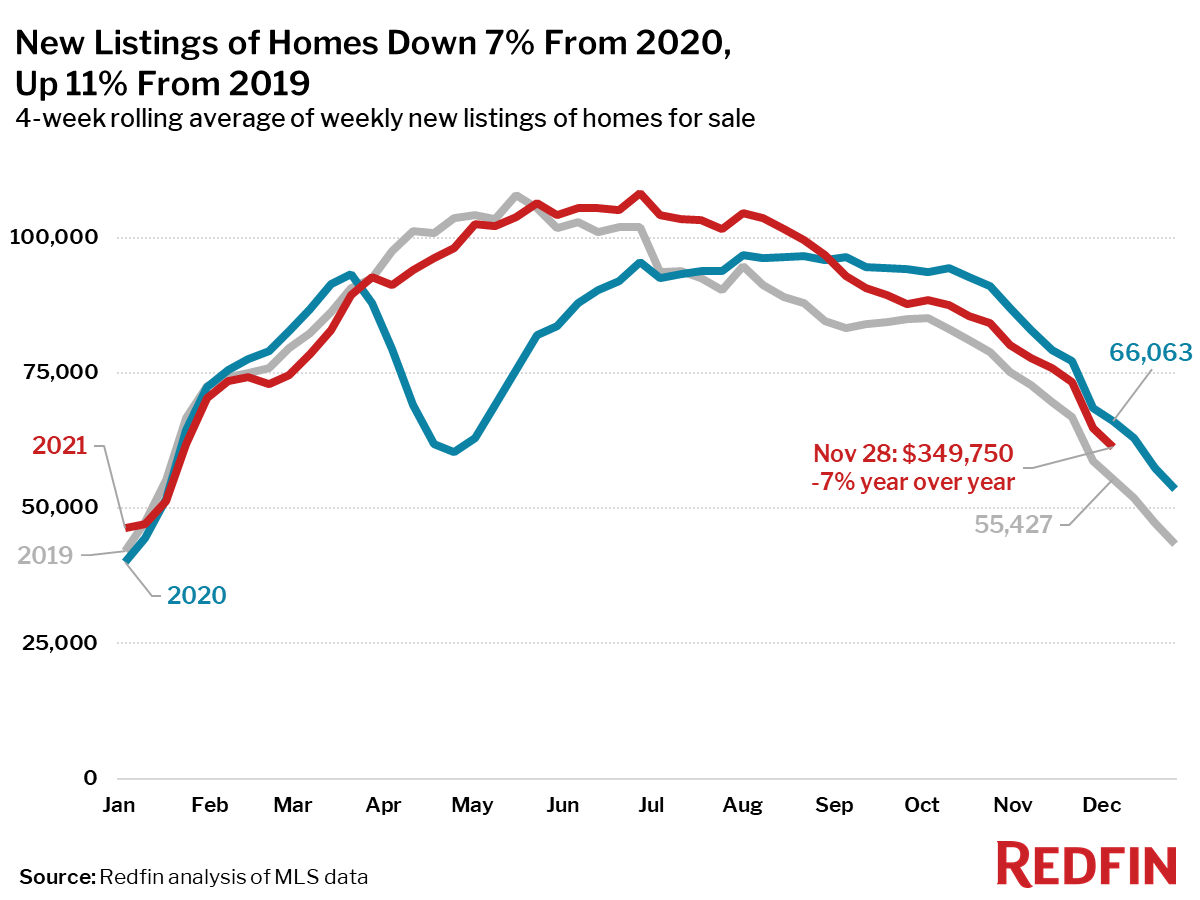
- New listings of homes for sale were down 7% from a year earlier, but up 11% from 2019.
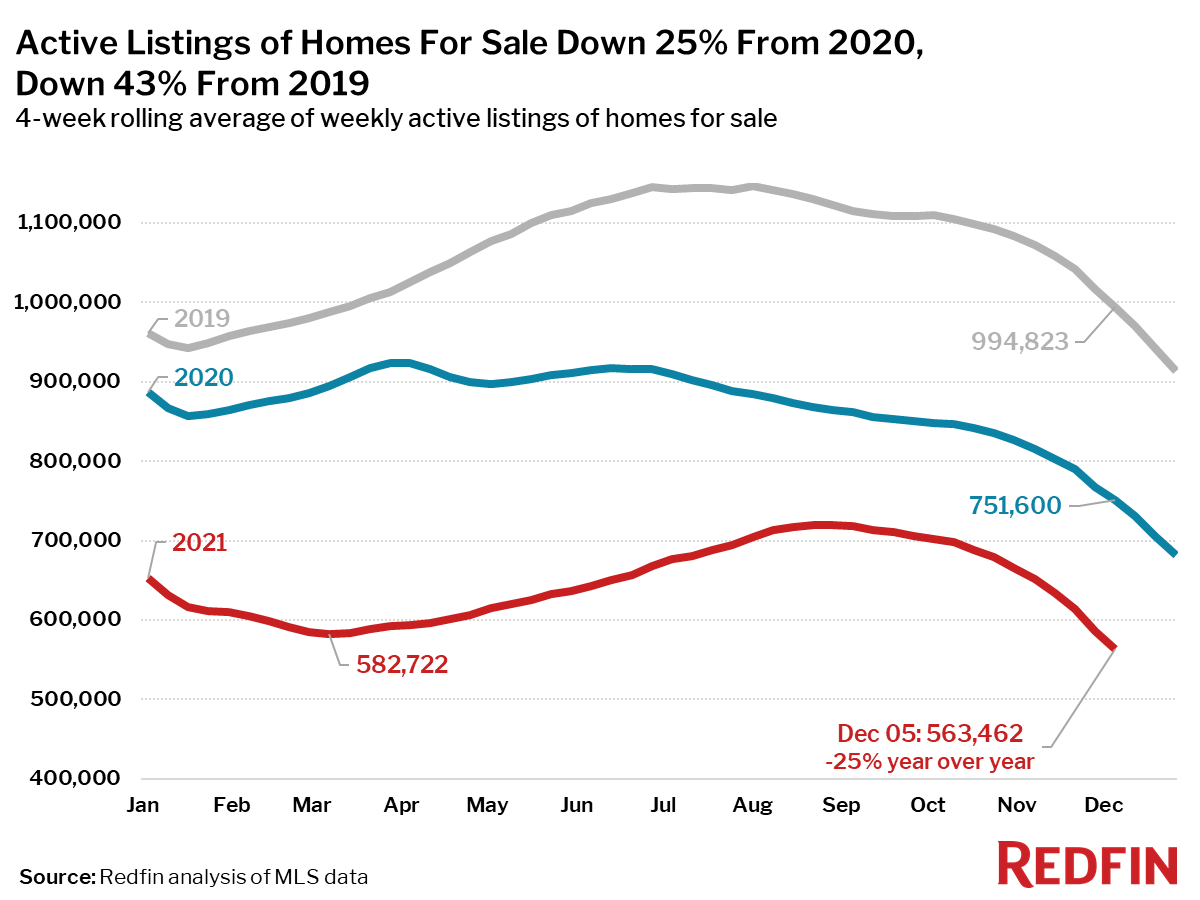
- Active listings (the number of homes listed for sale at any point during the period) fell to a new all-time low, down 25% from 2020 and 43% from 2019.
- After climbing in a counter-seasonal trend during October and November, the share of homes that went under contract that had an accepted offer within the first two weeks on the market fell nearly 2 points from the four-week period ending November 28 to 43%, still above the 36% rate of a year earlier and the 27% rate in 2019.
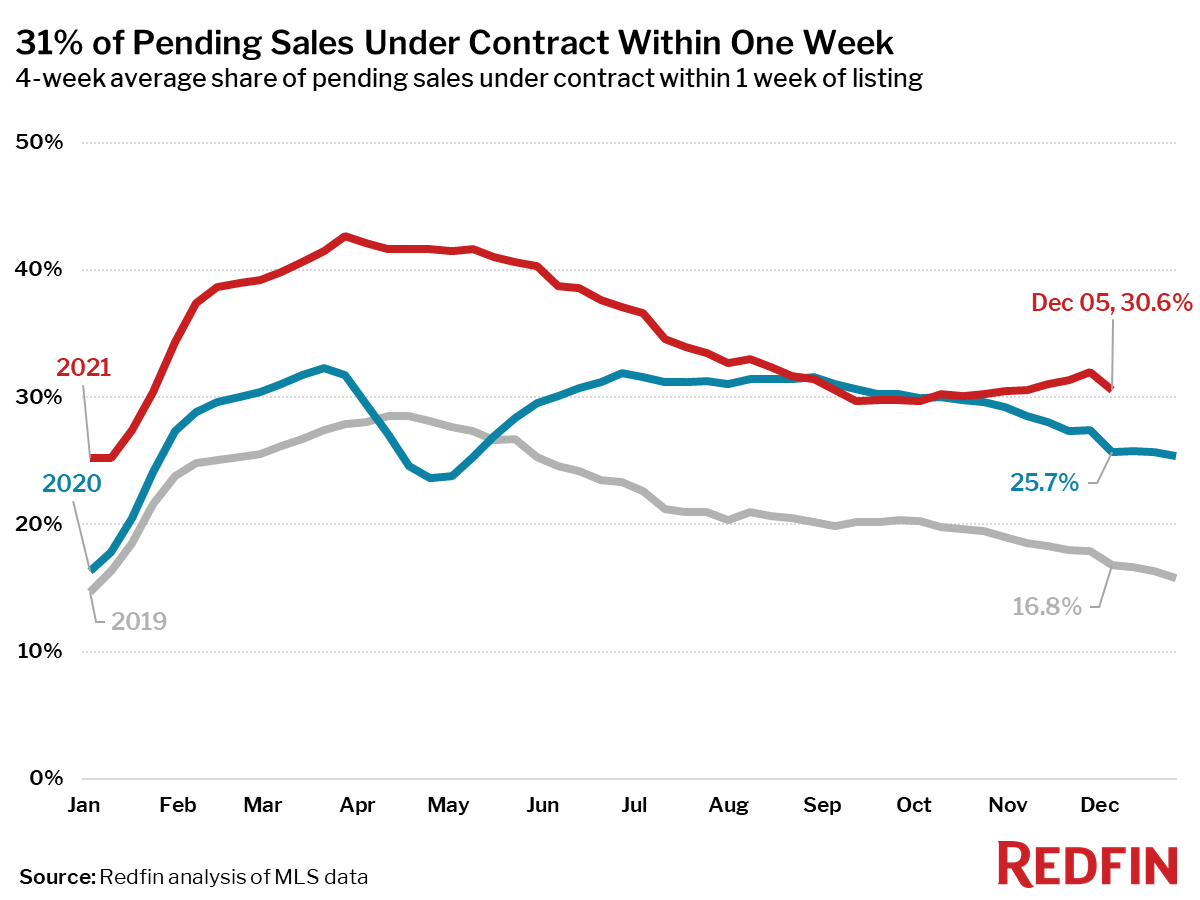
- 31% of homes that went under contract had an accepted offer within one week of hitting the market, up from 26% during the same period a year earlier and 17% in 2019. This measure also reversed course in the latest week and began a more typical seasonal decline.
- Homes that sold were on the market for a median of 25 days, down from 31 days a year earlier and 47 days in 2019.
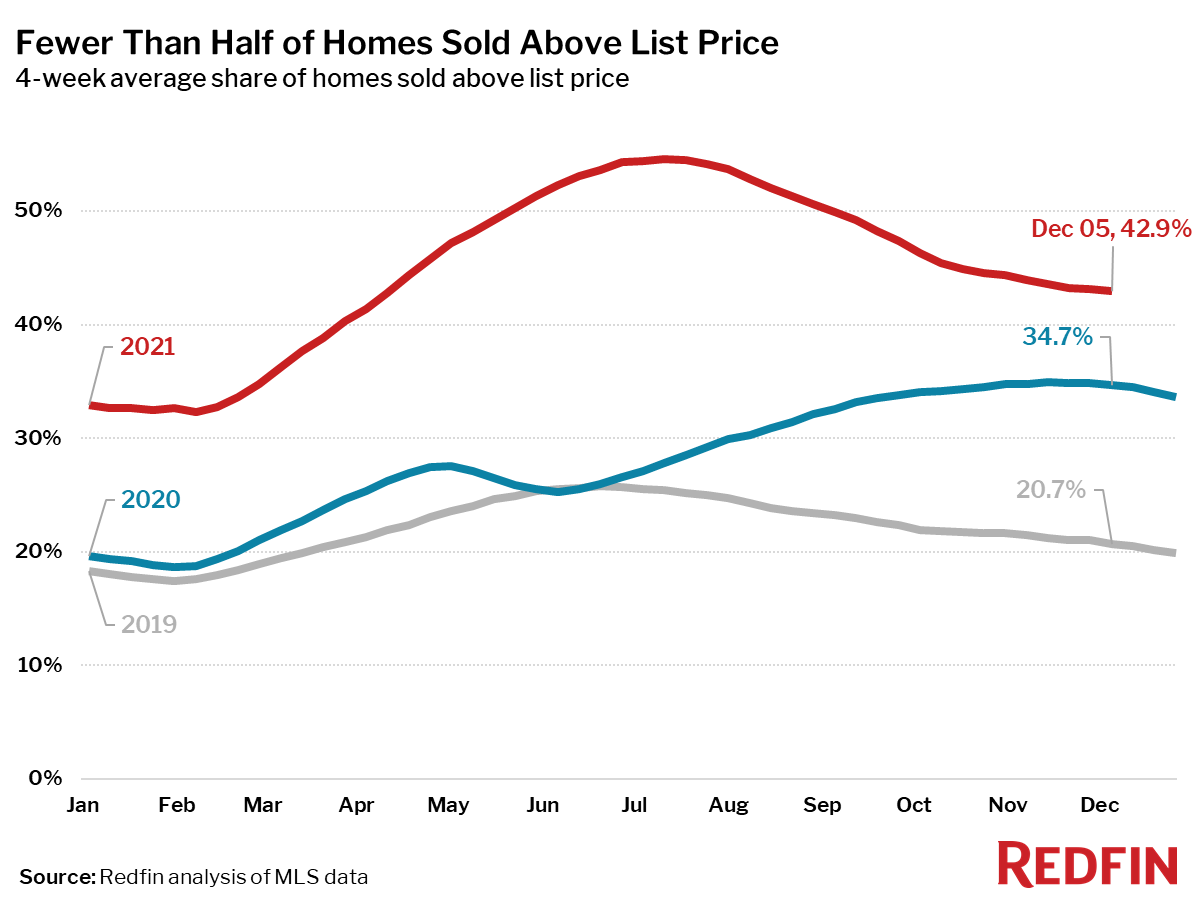
- 43% of homes sold above list price, up from 35% a year earlier and 21% in 2019.
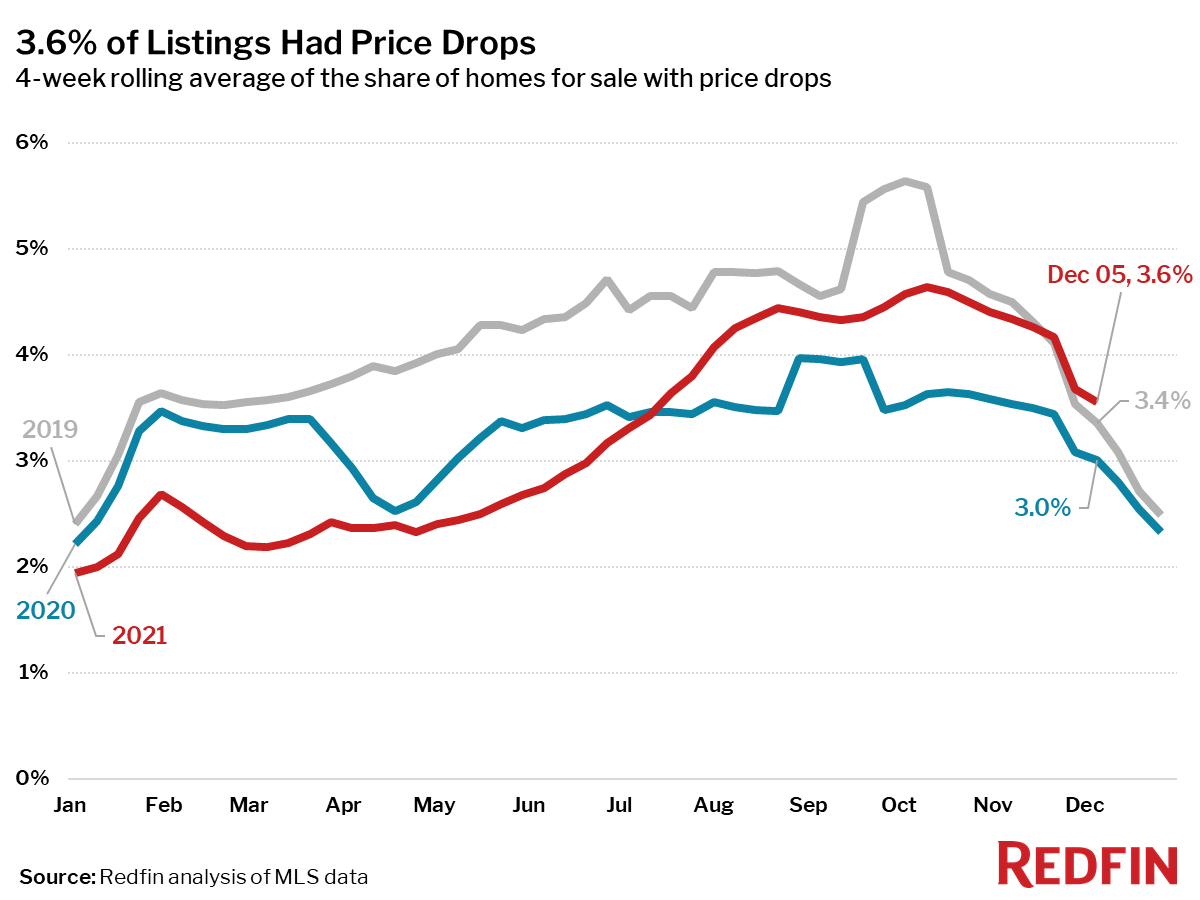
- On average, 3.6% of homes for sale each week had a price drop, up 0.6 percentage points from the same time in 2020 and up 0.2 points from this time in 2019.
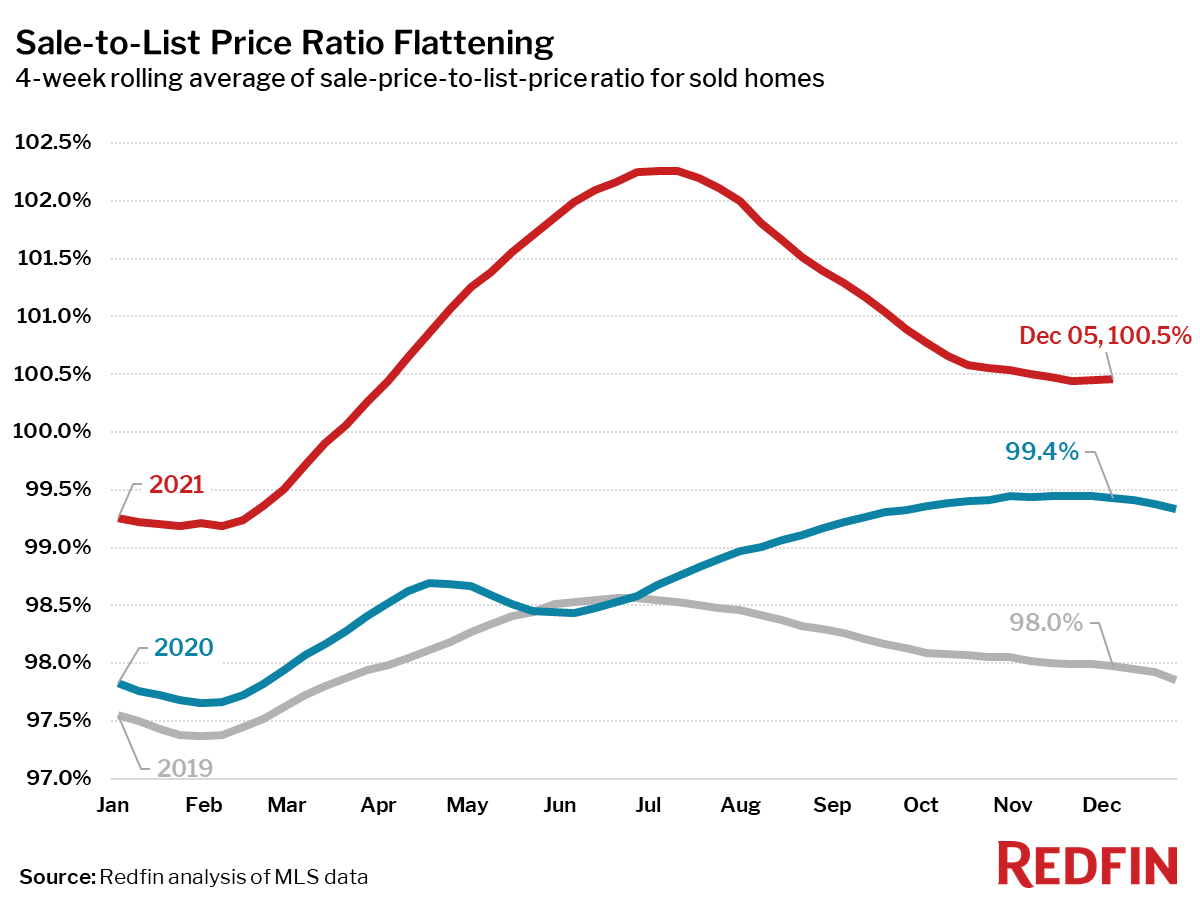
- The average sale-to-list price ratio, which measures how close homes are selling to their asking prices, was 100.5%. In other words, the average home sold for 0.5% above its asking price.
Other leading indicators of homebuying activity:
- Mortgage purchase applications decreased 5% week over week (seasonally adjusted) during the week ending December 3. For the week ending December 2, 30-year mortgage rates were flat at 3.1%.
- Touring activity through December 5 was 12 percentage points ahead of 2019 relative to the first week of January, according to home tour technology company ShowingTime.
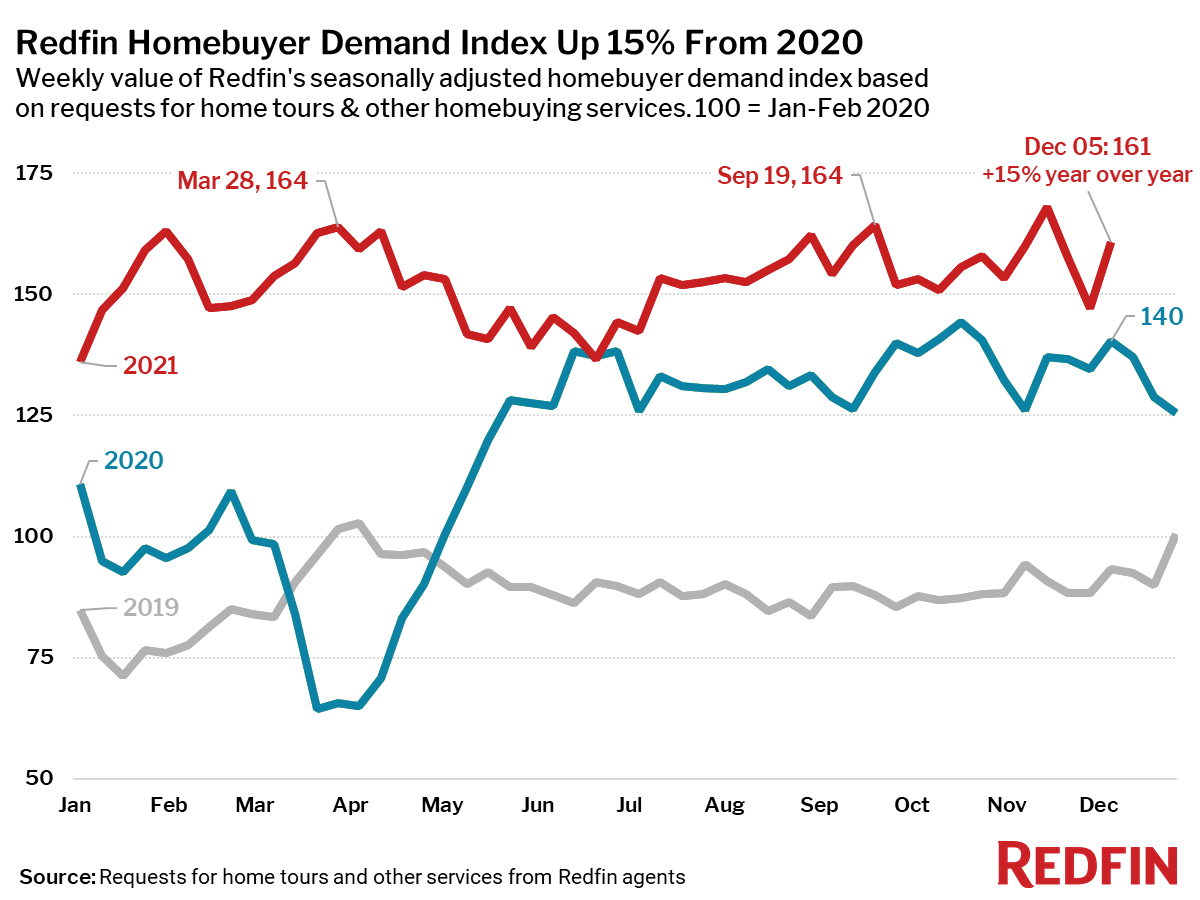
- The Redfin Homebuyer Demand Index rose 9% during the week ending December 5 and was up 15% from a year earlier.

