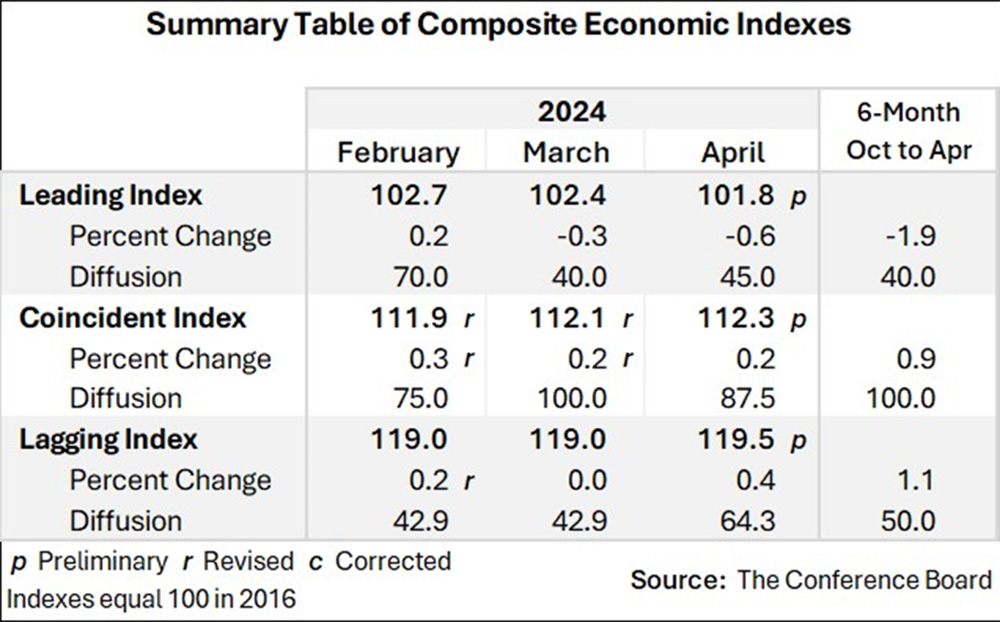
The Conference Board Leading Economic Index® (LEI) for the U.S. decreased by 0.6 percent in April 2024 to 101.8 (2016=100), after decreasing by 0.3 percent in March. Over the six-month period between October 2023 and April 2024, the LEI contracted by 1.9 percent—a smaller decrease than its 3.5 percent decline over the previous six months.
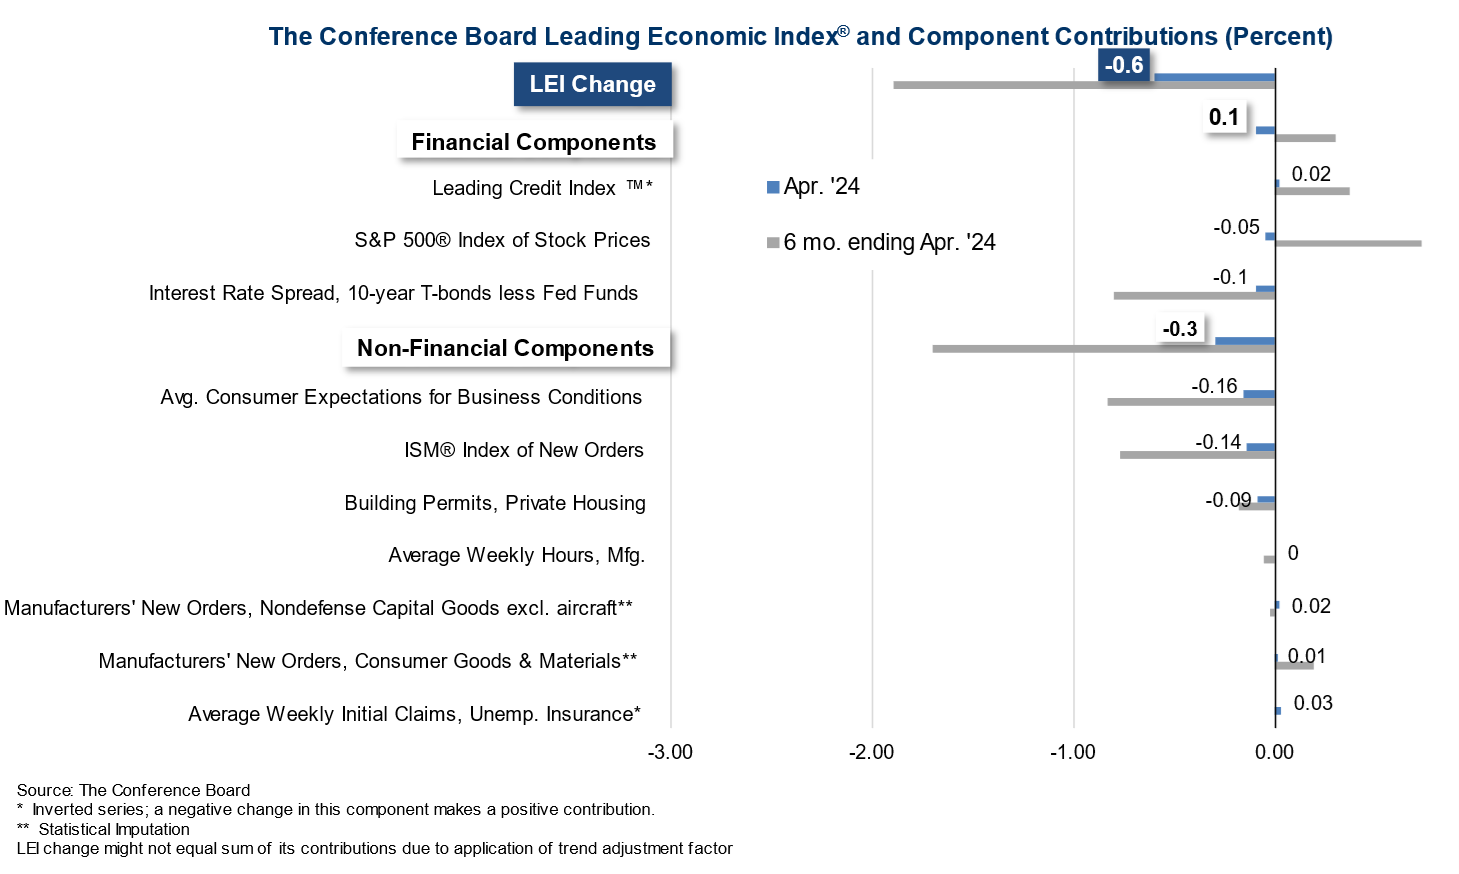
“Another decline in the U.S. LEI confirms that softer economic conditions lay ahead,” said Justyna Zabinska-La Monica, Senior Manager, Business Cycle Indicators, at The Conference Board. “Deterioration in consumers’ outlook on business conditions, weaker new orders, a negative yield spread, and a drop in new building permits fueled April’s decline. In addition, stock prices contributed negatively for the first time since October of last year. While the LEI’s six-month and annual growth rates no longer signal a forthcoming recession, they still point to serious headwinds to growth ahead. Indeed, elevated inflation, high interest rates, rising household debt, and depleted pandemic savings are all expected to continue weighing on the US economy in 2024. As a result, we project that real GDP growth will slow to under 1 percent over the Q2 to Q3 2024 period.”
The Conference Board Coincident Economic Index® (CEI) for the U.S. rose by 0.2 percent in April 2024 to 112.3 (2016=100), after also increasing by 0.2 percent in March. As a result, the CEI was up 0.9 percent over the six-month period ending April 2024, slightly ahead of its 0.8 percent increase over the previous six months. The CEI’s component indicators—payroll employment, personal income less transfer payments, manufacturing and trade sales, and industrial production—are included among the data used to determine recessions in the US. All four components of the index improved last month. Personal income less transfer payments made the largest positive contribution to the Index.
The Conference Board Lagging Economic Index® (LAG) for the U.S. increased by 0.4 percent in April 2024 to 119.5 (2016=100), after remaining unchanged in March. The LAG was up by 1.1 percent over the six-month period from October 2023 and April 2024, a substantial improvement of a 0.3 percent increase over the previous six months.
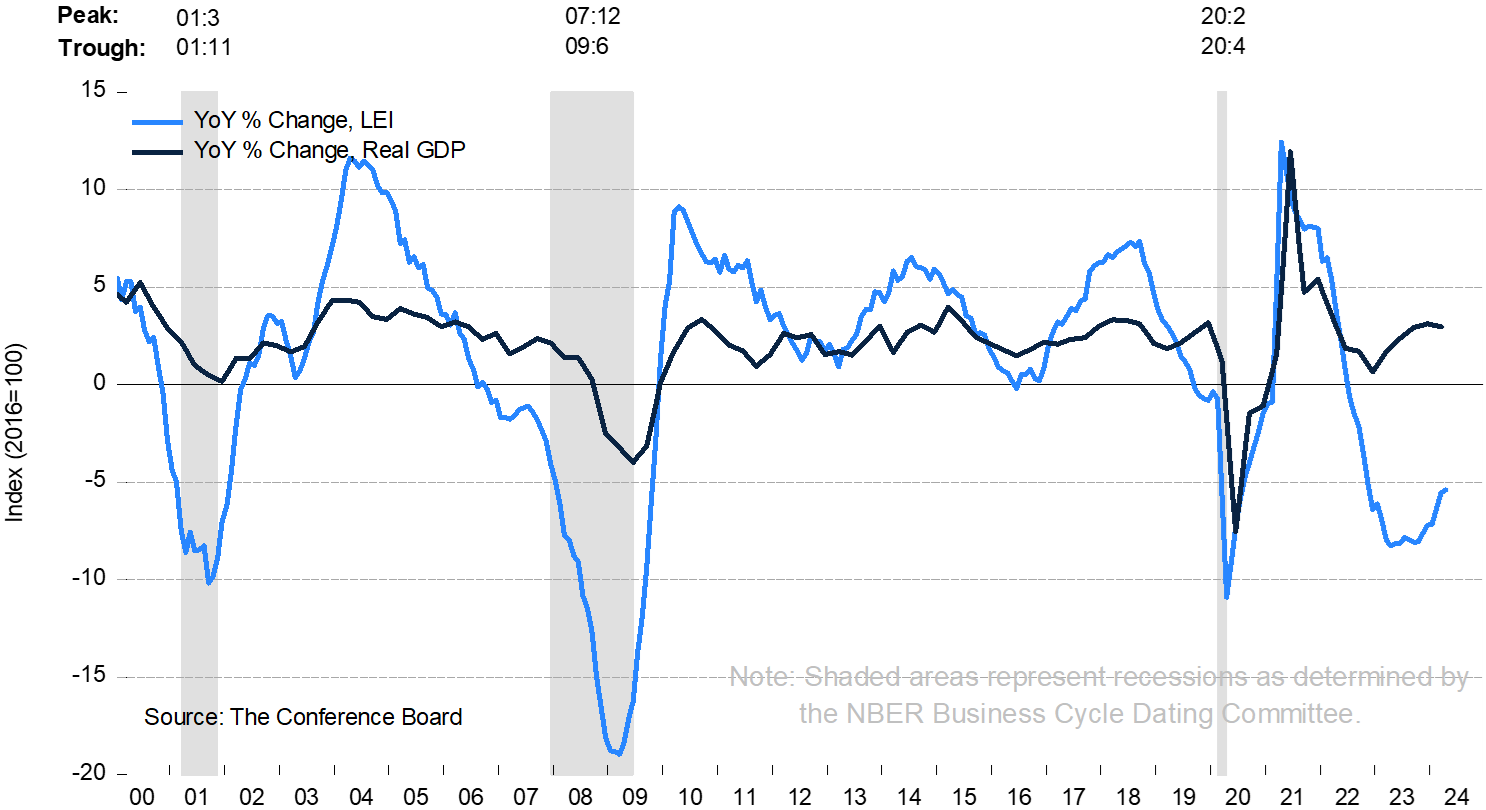
The LEI’s year-over-year growth rate has become less negative
The LEI’s April decline was driven by consumer sentiment, new orders, a negative yield spread and building permits
Note: Starting with September 2023 release Leading Credit Index™ calculations (from 2020 to current) use the SOFR Overnight Financing Rate in the USD Swap spread semiannual 2 year instead of LIBOR rate. LIBOR remains in the USD Swap spread semiannual 2 year from 1990 to 2020.
The LEI did not signal a recession for the second consecutive month due to improvement in the six-month growth rate
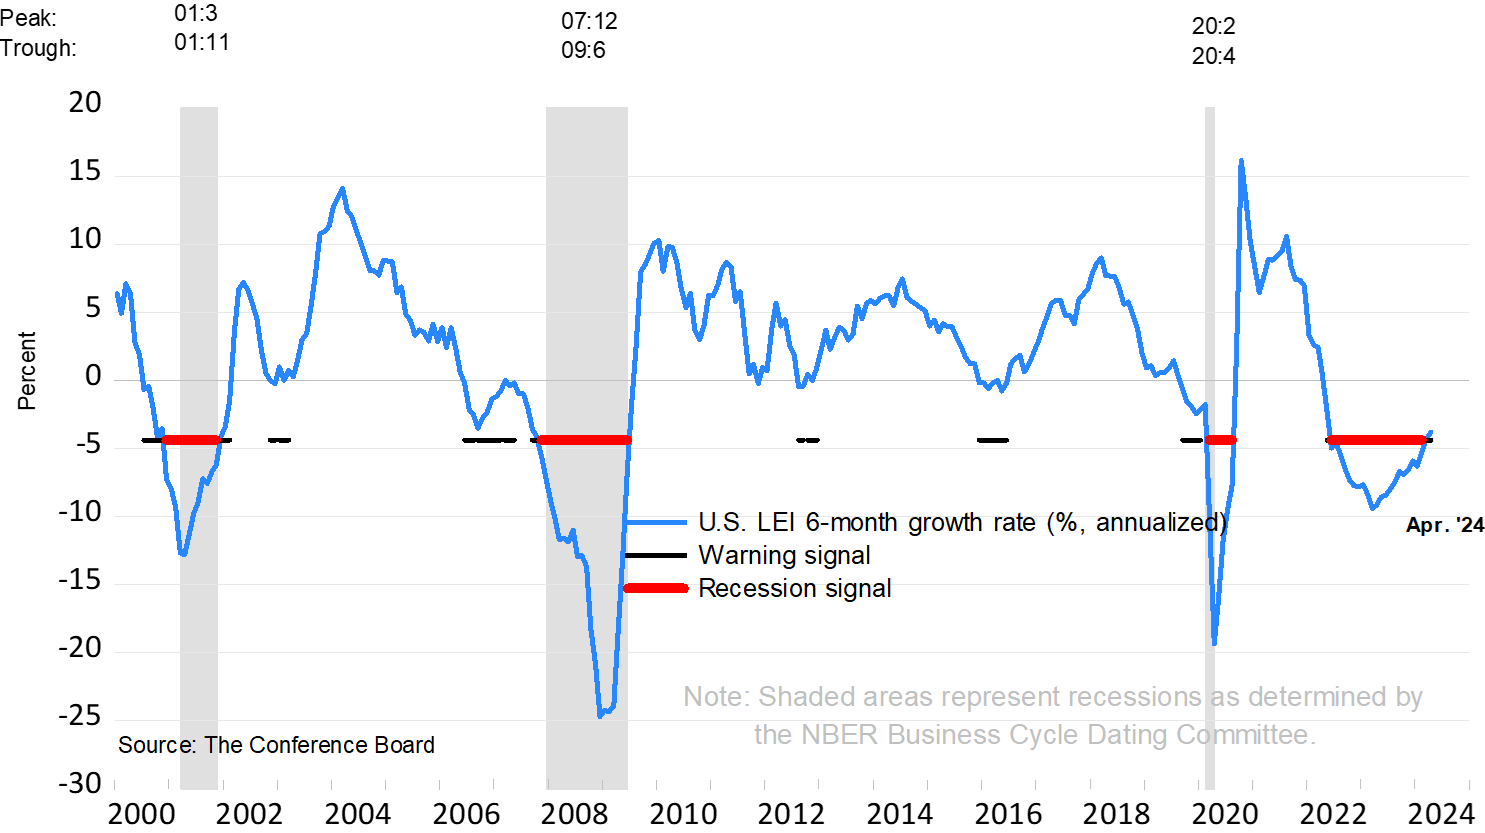
Note: The chart illustrates the so-called 3Ds rule which is a reliable rule of thumb to interpret the duration, depth, and diffusion – the 3Ds – of a downward movement in the LEI. Duration refers to how long-lasting a decline in the index is, and depth denotes how large the decline is. Duration and depth are measured by the rate of change of the index over the last six months. Diffusion is a measure of how widespread the decline is (i.e., the diffusion index of the LEI ranges from 0 to 100 and numbers below 50 indicate most of the components are weakening). The 3Ds rule provides signals of impending recessions 1) when the diffusion index falls below the threshold of 50 (denoted by the black dotted line in the chart), and simultaneously 2) when the decline in the index over the most recent six months falls below the threshold of -4.4 percent. The red dotted line is drawn at the threshold value (measured by the median, -4.4 percent) on the months when both criteria are met simultaneously. Thus, the red dots signal a recession.