


Despite the fact that the coronavirus-driven recession disproportionately impacted women in 2020, single women purchased 8.7% more homes in the fourth quarter than a year earlier, according to a new report from Redfin, the technology-powered real estate brokerage. That’s a larger increase than single men, who purchased 4.6% more homes in the fourth quarter than a year earlier. Couples bought 11.5% more homes than a year earlier.
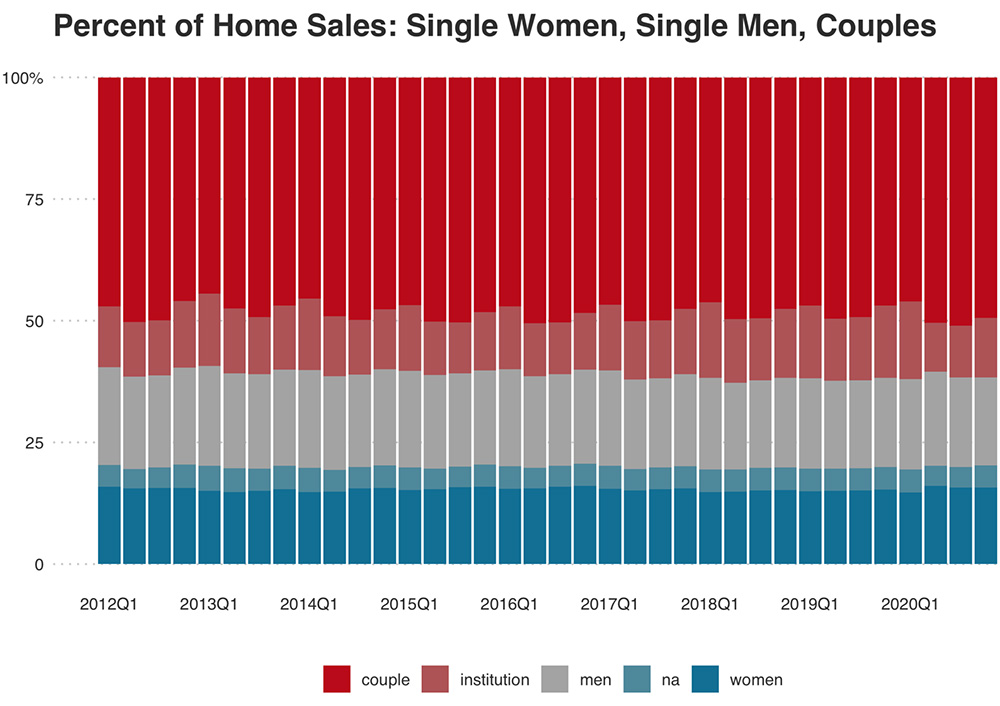
Single women made up 15.7% of total home purchases nationwide in the fourth quarter of 2020, compared with 15.3% a year earlier. The share has remained stable between 14.8% and 16.1% since 2012. This is even as the pandemic-driven recession forced women out of the workforce at a greater rate than men, especially women of color. Even before the pandemic, women earned just 82 cents for every dollar earned by men. The recession hit women-dominated industries—including restaurants, retail and healthcare—hardest, and many women have chosen to leave paying jobs to take care of children.
“This is another illustration of America’s uneven financial recovery,” said Redfin chief economist Daryl Fairweather. “While millions of women have lost their jobs during this recession, the impact has largely been on lower-income women. Meanwhile, most women who were able to afford homes before the pandemic are likely still able to afford homes, and low mortgage rates—especially at the end of 2020—have been incentivizing them to buy.”
Single men made up 18.1% of home purchases in the fourth quarter, essentially flat from 18.3% a year earlier. The share of home purchases by single men also hasn’t varied much over the past eight years, spanning from 17.8% to 20.1%. Couples—two (or more) people buying a home together—made up 49.4% of purchases in the fourth quarter, up slightly from 46.9% the year before. The remainder of home purchases were either made by institutions or they fall into the “other” category.
Women tend to buy less expensive homes than men. The typical home purchased by single women in the fourth quarter sold for $294,000, up 15% year over year. That’s compared with $310,000 for single men, up 17% year over year, and $430,000 for couples, up 15%. The median monthly mortgage payment for single women was $1,052 in the fourth quarter, compared with $1,125 for single men and $1,535 for couples.
Single women made up more than one-quarter of home purchases in Boston in 2020
Single women make up a larger share of homebuyers than single men in just two of the 43 metro areas included in Redfin’s analysis. In Boston, single women made up 25.4% of home purchases in the fourth quarter, compared with 23.3% for single men. And in West Palm Beach, single women made up 16.8% of home purchases, versus 15.6% for single men.
Boston also had the highest share of home purchases by single women last year of any metro. Forty-seven percent of women in Boston have a college degree or higher, the fourth-highest share of any major metro in the U.S., behind San Francisco, San Jose and Washington, D.C. Boston also has a lot of well-paying jobs that tend to be dominated by women, such as higher education and healthcare.
Boston is followed by Providence—located just about 50 miles away from Boston—where single women made up 21.2% of home purchases in 2020. Next come Detroit (20.6%), Atlanta (19.4%), Cleveland (18.9%) and Philadelphia (18.9%). The median sale price of homes purchased by single women in 2020 was less than $400,000 in all six of those metros, and it was under $200,000 in Detroit and Cleveland.
On the other end of the spectrum, single women made up just 6.3% of home purchases in San Jose in 2020, a lower share than any other metro. Next come a handful of other expensive California and New York metros: San Francisco (8%), Anaheim (10.3%), Oakland (10.6%), New York, San Diego and Nassau County, NY (11.2% apiece).
| Share of homes purchased by single women by metro area, 2020 | ||||||
| Redfin metro | Percent of home purchases by single women | Homes purchased by single women, YoY | Percent of home purchases by single men | Homes purchased by single men, YoY | Median monthly mortgage payment (women) | Median sale price (women) |
| Boston, MA | 25.4% | -1.7% | 23.3% | 6.1% | $1,256 | $384,900 |
| Providence, RI | 21.2% | 0.4% | 26.1% | -2.1% | $1,007 | $270,000 |
| Detroit, MI | 20.6% | -30.1% | 28.3% | -30% | $564 | $140,000 |
| Warren, MI | 19.6% | -5.6% | 27.8% | -8.5% | $704 | $185,000 |
| Atlanta, GA | 19.4% | 0.0% | 23% | -2.5% | $911 | $233,000 |
| Cleveland, OH | 18.9% | -17.4% | 23% | -12.3% | $554 | $144,000 |
| Philadelphia, PA | 18.9% | -9.1% | 20.5% | -8.8% | $824 | $209,900 |
| St. Louis, MO | 18.6% | -45.3% | 23.4% | -35.7% | $494 | $127,000 |
| Milwaukee, WI | 18.0% | 3.3% | 21.7% | 2.9% | $717 | $195,000 |
| Chicago, IL | 18.0% | -6.8% | 21% | -11.2% | $836 | $220,000 |
| Minneapolis, MN | 17.6% | 1.9% | 19.5% | 1.6% | $935 | $249,900 |
| Virginia Beach, VA | 17.6% | 15.7% | 24.2% | 16% | $901 | $225,000 |
| Baltimore, MD | 17.1% | -15.4% | 18.9% | -13.1% | $1,014 | $260,000 |
| Cincinnati, OH | 17.0% | -16.0% | 20.4% | -7% | $624 | $160,000 |
| West Palm Beach, FL | 16.8% | -3.7% | 15.6% | -3.5% | $938 | $240,000 |
| Tampa, FL | 16.7% | 0.8% | 17% | 2.8% | $819 | $208,000 |
| Phoenix, AZ | 16.6% | -5.8% | 24.8% | -10.1% | $1,051 | $285,000 |
| Las Vegas, NV | 16.6% | 2.4% | 21.7% | -3.8% | $1,063 | $280,000 |
| Pittsburgh, PA | 16.5% | -41.8% | 21.7% | -43.3% | $588 | $153,000 |
| Washington, DC | 16.5% | 1.5% | 17.2% | -2.8% | $1,401 | $365,000 |
| Columbus, OH | 16.3% | -8.4% | 18.1% | -8.7% | $710 | $191,500 |
| Fort Lauderdale, FL | 15.8% | -0.3% | 16.5% | -2% | $978 | $238,000 |
| New Brunswick, NJ | 15.6% | 7.7% | 16.9% | 3.6% | $1,054 | $285,000 |
| Denver, CO | 15.6% | -0.7% | 19.1% | -3.1% | $1,360 | $385,000 |
| Nashville, TN | 15.5% | -5.7% | 17.5% | -5.1% | $1,002 | $265,000 |
| Charlotte, NC | 15.0% | 3.6% | 15.1% | 2.5% | $868 | $227,500 |
| Sacramento, CA | 14.9% | 2.1% | 15.8% | 2.3% | $1,411 | $396,000 |
| Jacksonville, FL | 14.7% | -9.5% | 15.2% | -4.5% | $819 | $215,000 |
| Portland, OR | 14.4% | -16.6% | 15.9% | -13% | $1,382 | $381,177 |
| Orlando, FL | 14.0% | 2.1% | 20.5% | -4.9% | $914 | $236,000 |
| Montgomery County, PA | 13.9% | -10.0% | 15.6% | -12.1% | $1,021 | $280,000 |
| Newark, NJ | 13.0% | 3.1% | 16.8% | 0.8% | $1,194 | $320,000 |
| Riverside, CA | 13.0% | -2.0% | 19.3% | -2.4% | $1,329 | $358,000 |
| Los Angeles, CA | 12.5% | 0.0% | 15.4% | -7% | $2,014 | $585,000 |
| Seattle, WA | 11.5% | -20.4% | 13% | -20.9% | $1,699 | $492,000 |
| Miami, FL | 11.3% | -2.3% | 15.2% | 2.2% | $1,105 | $287,000 |
| Nassau County, NY | 11.2% | -10.7% | 14.1% | -11.6% | $1,643 | $449,998 |
| San Diego, CA | 11.2% | 3.5% | 15.7% | 7.8% | $1,807 | $520,000 |
| New York, NY | 11.2% | -9.7% | 14.5% | -9.6% | $1,682 | $485,000 |
| Oakland, CA | 10.6% | -4.0% | 11% | -14% | $2,062 | $600,000 |
| Anaheim, CA | 10.3% | -1.1% | 12.1% | 0.3% | $1,997 | $625,000 |
| San Francisco, CA | 8.0% | -9.0% | 10.5% | -14.9% | $3,128 | $1,070,000 |
| San Jose, CA | 6.3% | 2.8% | 8.8% | 2.2% | $2,510 | $819,500 |


