Prices of urban single-family homes are rising nearly 20% year over year—faster than any other type of home—according to a new report from Redfin, the technology-powered real estate brokerage. But this year’s hot housing market doesn’t discriminate: Urban condo sales are up nearly 30% year over year, more than any other home type.
Key takeaways from Redfin’s analysis, which looks at the housing market divided into five categories (urban single-family homes, suburban single-family homes, rural single-family homes, urban condos, suburban condos) during the 12 weeks ending April 4 include:
- Prices of urban single-family homes increased nearly 20% year over year, outpacing price growth rates for every other home category, a signal that buyers are searching for spacious homes near city amenities as vaccines roll out.
- Online listings of homes in large metros saw a 62% year-over-year increase in pageviews, bigger than the increases for homes in small towns and rural areas, another suggestion that buyers are returning to the city.
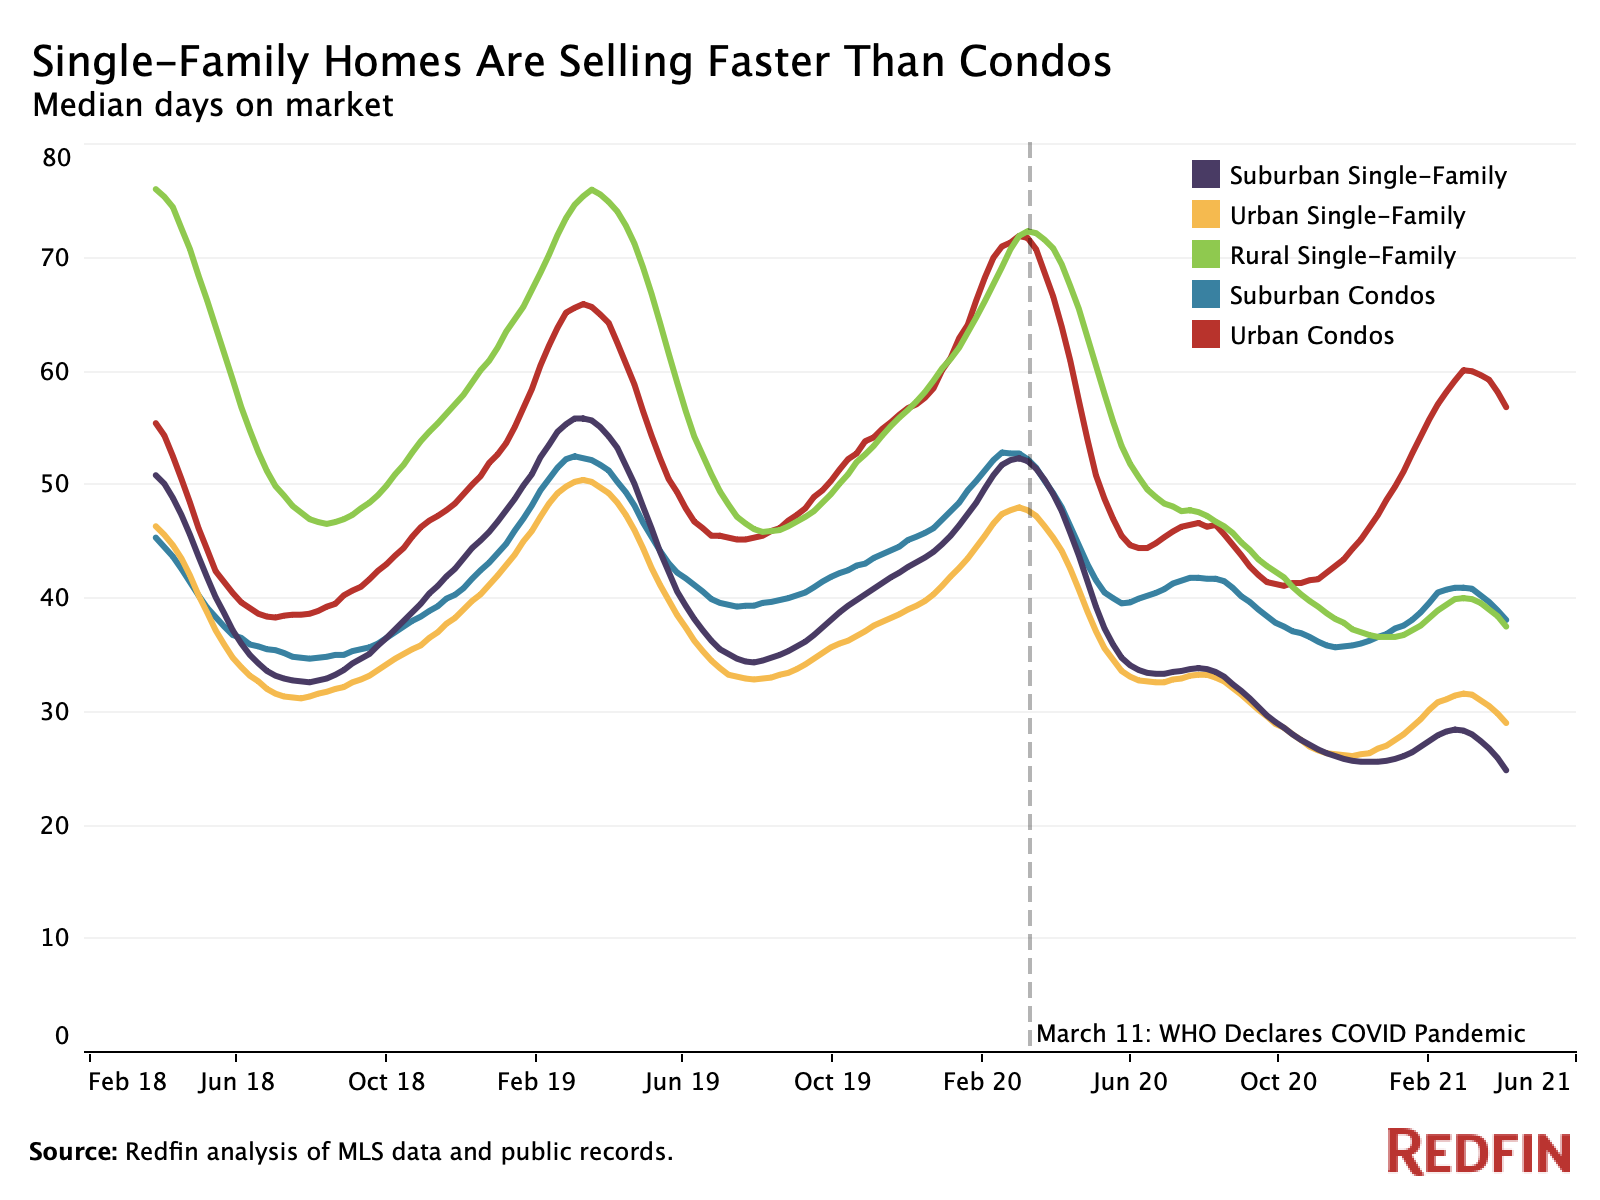
- Single-family homes sold faster than condos in all neighborhood types, indicating that buyers are clamoring for relatively large, private homes.
- Urban condos sales were up nearly 30% year over year, a bigger increase than any other home category, signaling that the condo market is recovering after plummeting last summer.
Urban single-family homes are currently seeing the fastest price growth partly because they offer the best of both worlds for many buyers, especially with the end of the pandemic in sight.
“Now that Americans have had a year to consider what the pandemic and its aftermath mean for their lifestyles, we’re seeing a lasting preference for single-family homes—but rural and suburban settings are no longer as popular as they were at the start of the pandemic,” said Redfin economist Taylor Marr. “Many homebuyers are still prioritizing features that were desirable at the beginning of the pandemic, like space for a home office or a big backyard, partly because many people plan to continue working from home. But as people venture out of their homes more often, they’re rediscovering the advantages of living in a city. People want to continue barbecuing in the backyard, but they also want the option of turning off the grill and walking to their local pizza place.”
The median sale price of single-family homes in urban neighborhoods is up 19.4% year over year to $286,000—the biggest increase on record, and a bigger price gain than any other category of home.
The fact that prices are growing faster for single-family homes than for condos in all types of neighborhoods indicates that many buyers in the pandemic era have a strong preference for self-contained homes without shared walls. Price growth for rural single-family homes outpaced all other home types from the beginning of the pandemic through the end of 2020, when price growth for urban single-family homes surpassed its rural counterpart.
Pageviews of homes in large metros are on the upswing, signaling a return to the city
Redfin.com pageviews of homes in metro areas with a population of more than 1 million—which include both urban and suburban neighborhoods—increased 62% year over year in March. That’s a bigger increase than the 30% gain for small towns and the 18% increase for rural areas. The fact that homebuyer interest in large metros is accelerating while it’s decelerating in rural areas and small towns suggests the pandemic-driven bump in demand for rural properties has peaked and buyers are returning to the city.
The year-over-year jump in pageviews for large metros is likely exaggerated because March marks one year since the pandemic hit the U.S. Last March, views of homes in that type of area dropped significantly as cities went under lockdown and buyers turned toward smaller towns.
Single-family homes are selling faster than condos
Another indicator of the hot single-family housing market is that single-family homes in all neighborhood types are selling faster than condos, and selling significantly faster than they were a year ago. The typical suburban single-family home spent 25 days on the market before going under contract during the 12 weeks ending April 4. Urban single-family homes are selling nearly as fast, with a median of 29 days on the market before going under contract.
Homes in all categories are selling significantly faster than they were a year ago, led by rural single-family homes, which are selling 32 days faster than last year. The increased speed for rural properties is reflective of the pandemic-driven surge in demand for spacious homes outside city centers: In the beginning of 2020, pre-pandemic, homes in rural areas sat on the market longer because fewer buyers were interested in living in far-flung areas with long commutes to the office.
Condos are picking up in popularity from a pandemic-driven plunge, even with the outsized popularity of single-family homes
Condo sales are picking up more than sales of single-family homes. The number of urban condos sold was up 29.9% year over year during the 12 weeks ending April 4, the biggest gain on record and a bigger increase than any other home category. It’s followed by suburban condos (22.8%).
The uptick in condo sales is a sign that the condo market is recovering after plummeting with the onset of the pandemic. During the 12 weeks ending June 29, 2020, sales of urban condos reached a record low, down 44.9% year over year. Sales of suburban condos dipped nearly as much, dropping 42.3%.
| Housing market data: Single-family homes and condos, urban/suburban/rural, 12 weeks ending April 4 | |||||
| Urban single-family homes | Suburban single-family homes | Rural single-family homes | Urban condos | Suburban condos | |
| Median sale price, YoY | 19.4% | 16.7% | 15.2% | 5.8% | 10.6% |
| Median sale price | $285,631 | $357,625 | $293,971 | $340,571 | $233,993 |
| Median price per square foot | $173 | $174 | $151 | $315 | $192 |
| Median price per square foot, YoY | 19% | 16.8% | 15% | 5.3% | 12.5% |
| Number of homes sold, YoY | 12.2% | 7.1% | 7.4% | 29.9% | 22.8% |
| All homes for sale, YoY | -32.6% | -44.9% | -44.4% | -2% | -27% |
| New listings, YoY | 1.1% | -4.5% | 0% | 21.9% | 6.3% |
| Median days on market | 29 | 25 | 38 | 57 | 38 |
| Median days on market, YoY | -15 | -23 | -32 | -7 | -10 |
| Share of homes off market in two weeks | 54.1% | 57.5% | 52.4% | 40.9% | 46.8% |
| Housing market data for urban condos by metro area, 12 weeks ending April 450 metros with most urban condos sold in the relevant time period
Ranked from highest to lowest sales growth |
||||
| Metro area | Number of homes sold, YoY | Median sale price | Median sale price, YoY | New listings, YoY |
| North Port, FL | 106.2% | $378,204 | 20.4% | 24.6% |
| Naples, FL | 85.1% | $551,500 | 9.4% | 18.5% |
| Deltona, FL | 61.2% | $187,837 | -13.0% | 16.8% |
| San Francisco, CA | 59.3% | $1,114,240 | -4.0% | 29.2% |
| Miami, FL | 57.4% | $312,229 | 19.8% | 23.1% |
| Oakland, CA | 53.5% | $532,833 | -4.2% | 58.0% |
| Riverside, CA | 47.5% | $341,521 | 12.7% | 11.4% |
| Houston, TX | 45.7% | $152,267 | 4.5% | 20.9% |
| West Palm Beach, FL | 43.3% | $315,229 | 54.0% | 5.4% |
| Austin, TX | 42.8% | $396,992 | 13.7% | 7.3% |
| Salt Lake City, UT | 42.6% | $305,671 | 13.4% | -12.3% |
| Fort Lauderdale, FL | 41.8% | $209,250 | 16.6% | -9.1% |
| Phoenix, AZ | 39.2% | $234,235 | 11.8% | 3.5% |
| Frederick, MD | 38.4% | $262,311 | -17.0% | 34.4% |
| Dallas, TX | 37.7% | $231,771 | 0.1% | 10.5% |
| Tampa, FL | 37.6% | $276,371 | 23.9% | 7.1% |
| Anaheim, CA | 36.5% | $525,833 | 11.6% | 8.4% |
| Minneapolis, MN | 35.8% | $231,512 | -1.3% | 27.1% |
| Tucson, AZ | 35.0% | $126,542 | 18.3% | 25.0% |
| Baltimore, MD | 34.6% | $188,971 | -4.6% | 9.1% |
| San Diego, CA | 33.3% | $473,750 | 11.3% | 16.7% |
| Washington, DC | 33.1% | $373,413 | -8.0% | 32.9% |
| Cape Coral, FL | 32.6% | $280,745 | 4.4% | 1.5% |
| Orlando, FL | 32.4% | $145,633 | 5.9% | 4.0% |
| Los Angeles, CA | 32.3% | $550,417 | 1.6% | 35.6% |
| Charleston, SC | 32.3% | $356,071 | -3.6% | 9.6% |
| Urban Honolulu, HI | 31.8% | $433,733 | 1.6% | -0.1% |
| Las Vegas, NV | 31.1% | $164,871 | 8.6% | 5.9% |
| Virginia Beach, VA | 29.4% | $222,108 | 10.4% | 15.0% |
| San Jose, CA | 28.2% | $684,604 | 4.0% | 43.9% |
| Chicago, IL | 27.7% | $320,463 | 4.9% | 21.1% |
| Nashville, TN | 27.3% | $347,146 | 6.3% | 26.3% |
| New Brunswick, NJ | 27.2% | $300,667 | 3.1% | 37.1% |
| Cincinnati, OH | 26.5% | $208,383 | 6.1% | 19.8% |
| Jacksonville, FL | 26.4% | $198,838 | 2.4% | 17.7% |
| Columbus, OH | 25.7% | $222,667 | 20.7% | 17.3% |
| Indianapolis, IN | 24.5% | $173,958 | 11.2% | -4.6% |
| Bridgeport, CT | 24.1% | $273,892 | 20.9% | 44.5% |
| Cleveland, OH | 23.1% | $121,884 | -9.8% | 5.3% |
| Providence, RI | 22.1% | $219,029 | 4.8% | 0.0% |
| Seattle, WA | 20.6% | $441,958 | -4.3% | 37.9% |
| Denver, CO | 20.4% | $309,616 | 7.0% | 4.2% |
| Portland, OR | 19.5% | $338,258 | 11.1% | 32.0% |
| New Orleans, LA | 19.3% | $278,931 | 6.9% | 24.5% |
| Atlanta, GA | 18.0% | $246,063 | 1.8% | 64.2% |
| Richmond, VA | 16.8% | $322,898 | 24.9% | 4.3% |
| Philadelphia, PA | 12.1% | $301,615 | -9.9% | 48.4% |
| Milwaukee, WI | 11.9% | $201,038 | -11.5% | 17.6% |
| New York, NY | 11.8% | $663,646 | -1.4% | 47.3% |
| Boston, MA | 8.7% | $556,208 | -8.0% | 28.0% |