


Relational database service on cloud infrastructure has become a popular database solution. By nature, Database-as-a-Service products offer an opinionated observability suite to save customers from worrying about observability. However, large enterprises, such as Workday, have built internal observability platforms. Continuing to depend on the native observability suite for cloud databases like Amazon Aurora results in a fragmented picture of observability, affecting operations on Amazon Aurora and the related product as a whole. The challenge then is to integrate logging and monitoring of a complex cloud database system into an existing observability platform. This article presents a solution overview for observability for the AWS Aurora database.
Authors: Sandesh Achar, Nathaniel Louis Tisuela.
Source of Logs and Metrics
In order to integrate logging and monitoring of a Database Service into our observability platform, we identified sources where we can pull the Database service logs and metrics. Like most services on AWS, the main source of Amazon Aurora logs and metrics is CloudWatch. However, to supplement specific monitoring requirements, we also query the Amazon Aurora cluster for metrics not covered in CloudWatch.
Logs
PostgreSQL Logs from an Aurora Instance can be pushed to CloudWatch by enabling PostgreSQL log exports.
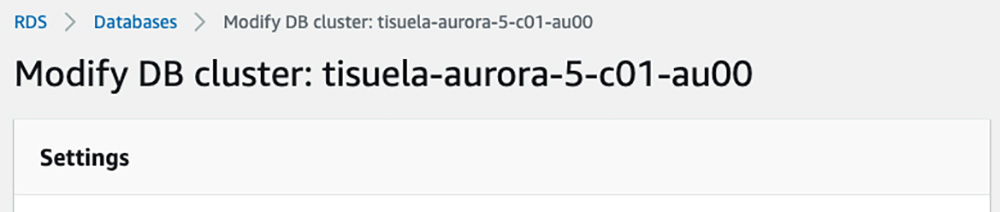
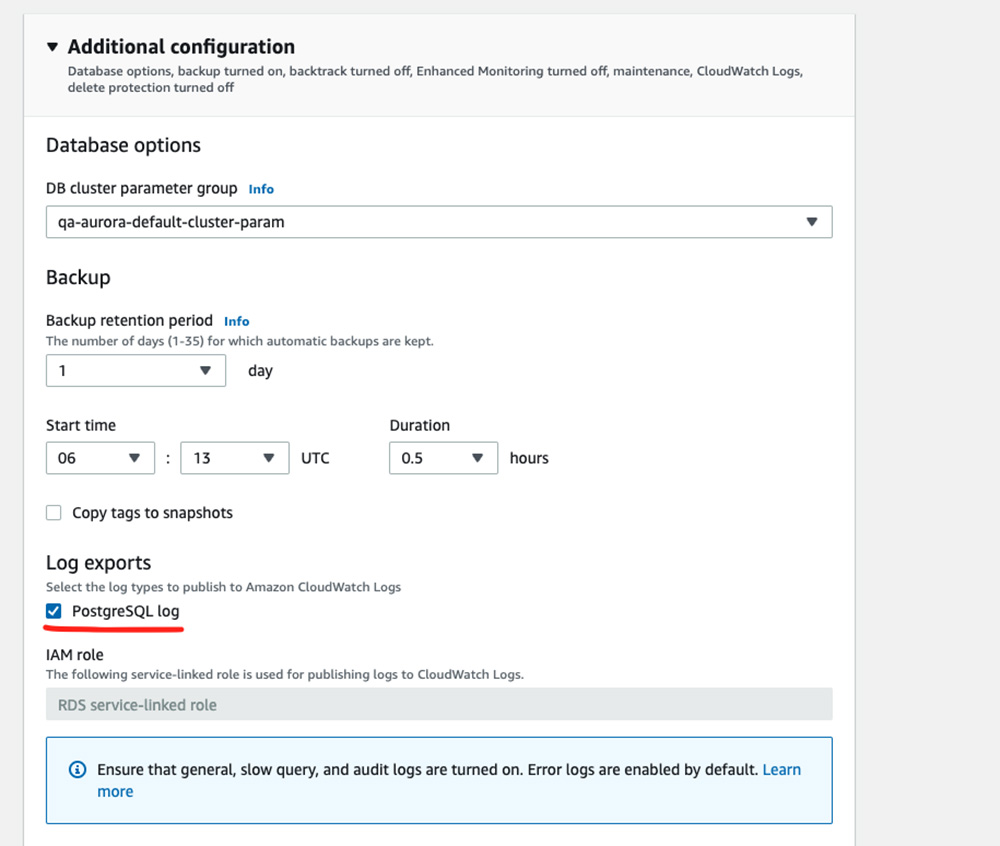
Fig 1: PostgreSQL Log Exports can be enabled when selecting “Modify” on an Aurora Cluster or Instance
For all logs from an Aurora Cluster to be available on CloudWatch, all Aurora Instances in the cluster should have PostgreSQL log exports enabled.
From there, the Aurora Cluster logs can be found in CloudWatch Logs. Each Aurora Cluster has a Log Group containing multiple log streams. Log streams are named according to their corresponding Aurora Instance.
Metrics
Similarly, Aurora Metrics can be found on CloudWatch metrics. Different metrics are available for Aurora Clusters and Aurora Instances. Available metrics also depend on the flavor of SQL being used. Enhanced Monitoring can be enabled for each Aurora Instance to push OS-level metrics to CloudWatch, for example, CPU utilization, database connections count, storage usage.
Fig 2: Enhanced Monitoring And Performance Insights can be enabled when selecting “Modify” on an Aurora Instance
Database metrics such as long queries and commits (Fig 3) can be pushed to CloudWatch by enabling Performance Insights for each instance (Fig 2).
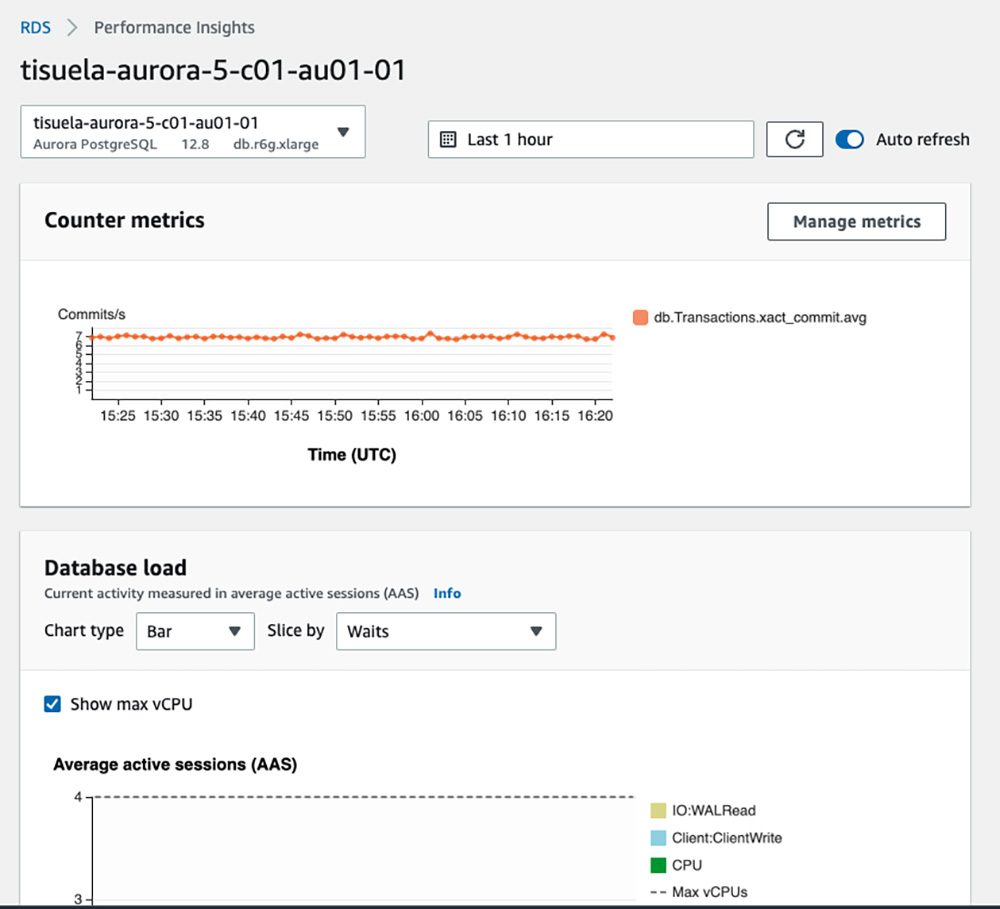
Fig 3: An Example Performance Insights dashboard
At Workday, we’ve decided to supplement metrics from CloudWatch with metrics obtained by queries to our databases hosted on Aurora. While enabling Database Service features such as Performance Insights is convenient, direct SQL queries for obtaining the same metrics allows for more control on what is collected and how often it is collected. This is important for alerting, where specific metrics and collection intervals are required.
Design
Recall that Database-as-a-Service products typically provide their own observability suite. When using Database services, installing third-party software for monitoring and logging directly on the Database services’ machines is difficult. While possible, such a practice adds on to the tech debt making the monitoring design more complicated, resulting in a spike in cost and maintenance.
Thus, it is important for our design to be an external system that plugs into existing sources of logs and metrics.
Automation
Aurora Clusters conveniently come with monitoring and logging out of the box. As soon as a cluster is spun up, logs and metrics can be available. Integrating Aurora to an observability platform should act the same — user intervention should not be required. Our solution should automatically obtain metrics and logs from Aurora Clusters.
Scalability
As Workday grows and gains more customers, there will be an increase of Aurora clusters. Our logging and monitoring solution should scale with this growth. It should be able to deal with large influxes of metrics and logs from performance tests or high activity. The solution should also scale down as Aurora clusters are decommissioned, releasing resources for efficiency.
Security
The solution should keep database credentials secure and comply with the principle of least privilege. The collection and shipping of logs and metrics should be done over HTTPS.
Intrusion detection, cloud native service for threat detection, data protection, security policies, Identity/access management policies, ingress/egress traffic security, continuous monitoring are in place to ensure security of all logs shipped to the observability platform.
Reliability
As an enterprise can have hundreds of Aurora Clusters, logging and monitoring should be distributed — the potential loss of observability for one cluster should not mean all clusters are affected. Furthermore, pushing updates to the solution should minimize downtime of logging and monitoring.
Maintainability
Log and metric collection should be consistent with what is used in our observability platform. Furthermore, it is good to use tools that integrate with the monitoring and logging of the concerned Cloud database platform.
Implementation
Our solution is a Kubernetes cluster that contains and manages Aurora Cluster log and metric collection. Logs and metrics are then shipped to our observability platform for ingestion.
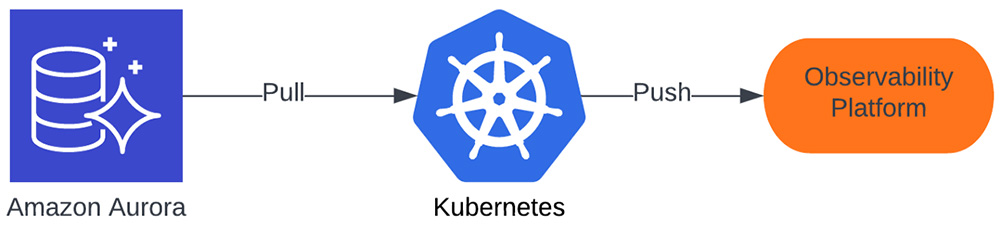
Fig 4: Solution overview
Kubernetes Cluster
A pod is created for each Aurora Cluster to collect logs (from CloudWatch) and metrics (from CloudWatch and our databases in the cluster). Log and metric shipping is performed using the same software as our observability platform, which natively supports metric/log collection from PostgreSQL databases and Amazon Cloudwatch.
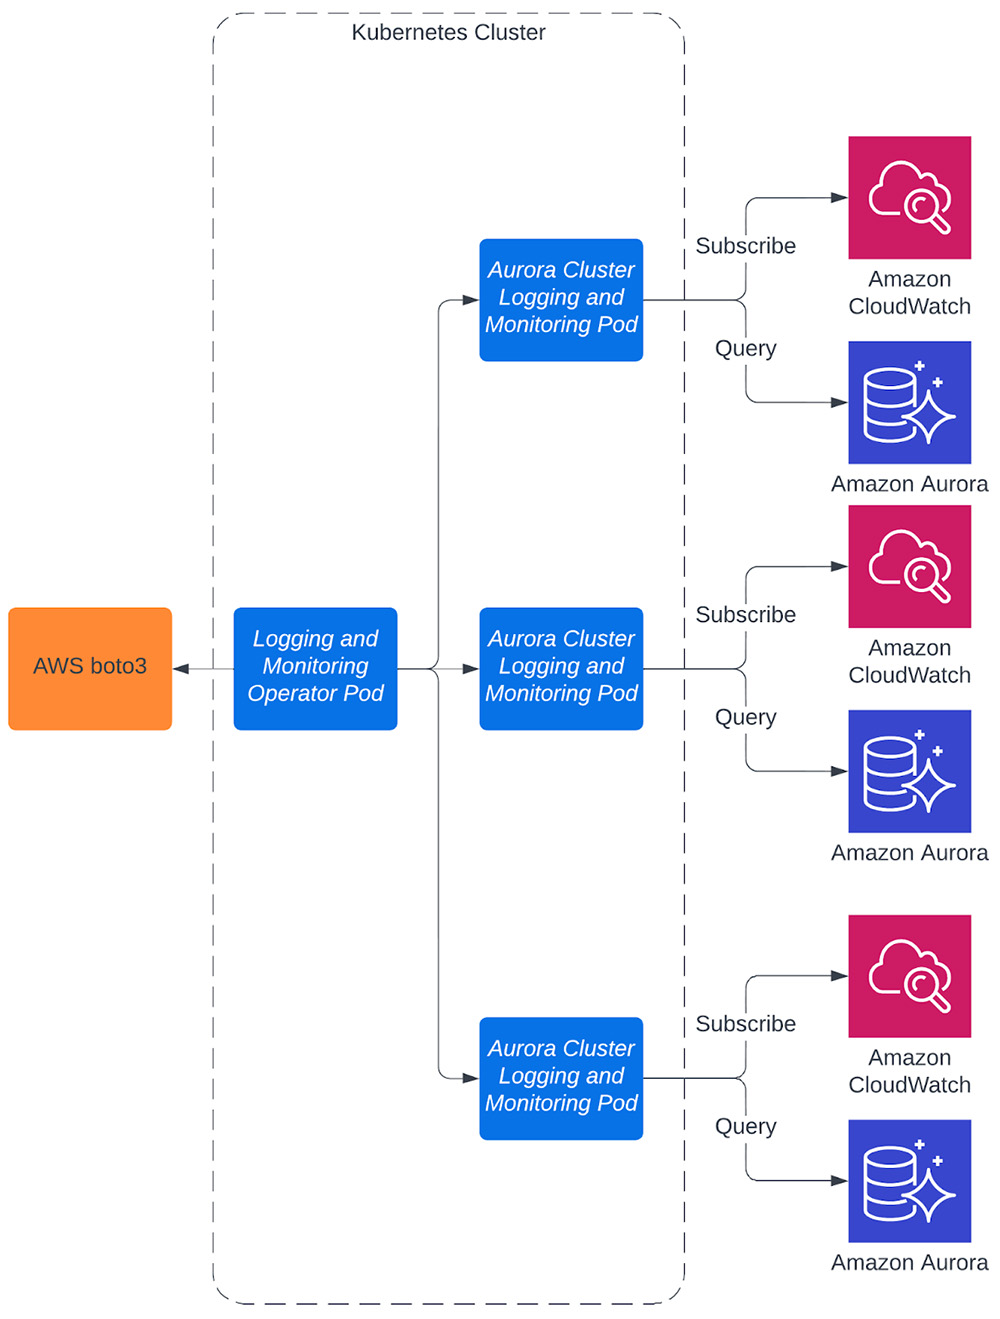
Fig 5: Integration pattern flow
Using this containerized approach allows us to distribute logging and monitoring of each Aurora Cluster. Each pod caters specific logging and monitoring configurations based on the purpose of that particular cluster.
Logging and Monitoring Pod
Each pod contains software to ship logs and metrics from an Aurora Cluster to our observability platform.
Fig 5 shows how each pod subscribes and queries data from CloudWatch and Aurora, respectively. We use Filebeat to ship logs from CloudWatch, benefiting from its built-in support for CloudWatch Logs [5]. Similarly, we use Telegraf’s built-in inputs for CloudWatch Metrics [6] and PostgreSQL Queries [7] to obtain ship metrics. Using existing tools for our solution makes it easier to build and maintain.
Filebeat and Telegraf each sit in a dedicated container. Appropriately, we enforce resource limits [8] that are specific for Telegraf and Filebeat containers, and we continue to monitor their resource consumption via a Telegraf Daemonset [9]. This is an efficient approach, as we found that Filebeat containers use substantially less resources than Telegraf containers.
The Monitoring and Logging Operator
The Operator pod manages all the Kubernetes resources used for our solution. The Operator manages all Kubernetes resources — secrets, config maps, deployments, etc. — for the logging and monitoring of Aurora Clusters. This is done by using and extending the Kubernetes API [3]. The process of managing these Kubernetes resources in response to Aurora Cluster provisioning can be seen in Fig 6.
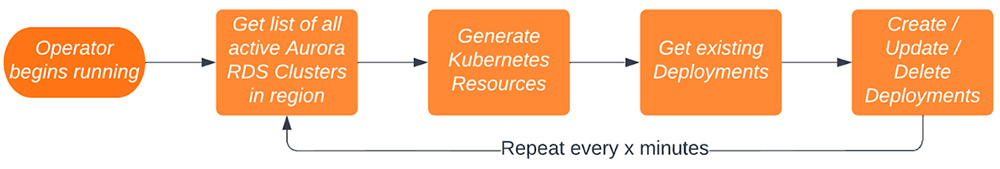
Fig 6: Simplification of the Operator Process
In addition to extending the Kubernetes API, the Operator also extends Amazon’s boto3 [4], an API for accessing data about services on AWS. This enables the Operator to build an accurate picture of each Aurora Cluster — this information is pertinent to configuring the appropriate logging and monitoring required for that cluster. Extending this cloud provider’s API also allows the Operator to identify the source of metrics and logs for each cluster. Fig 7 shows one of the boto3 [4] endpoints we use and extend.
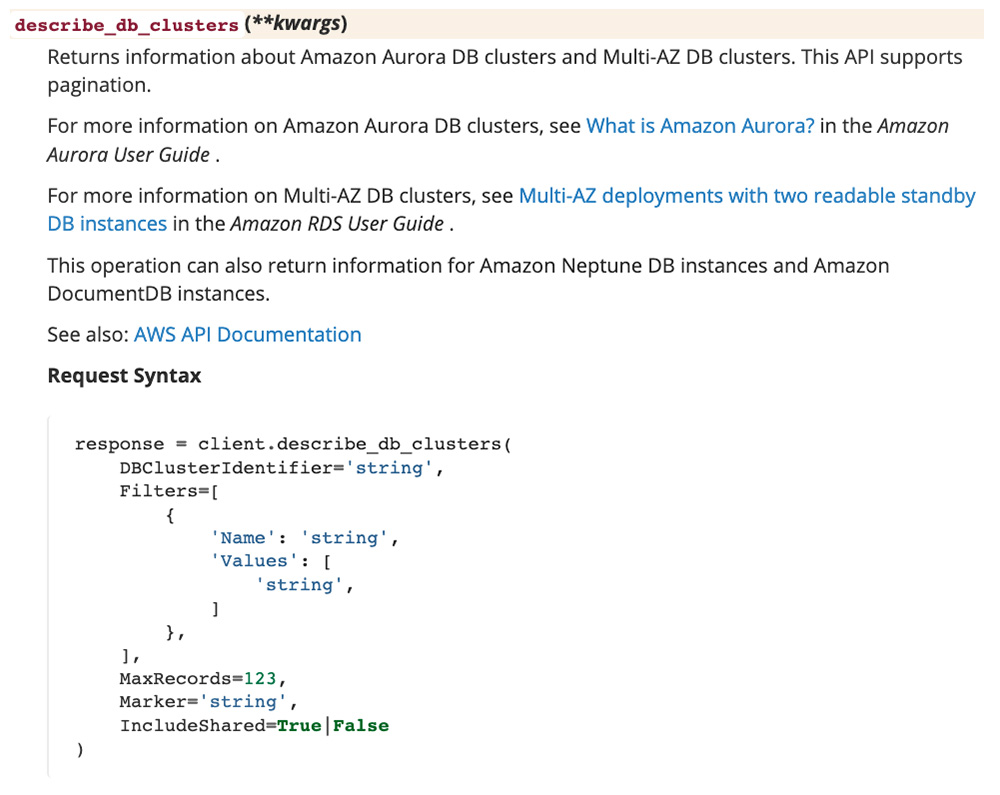
Fig 7: Boto3’s Describe DB Clusters endpoint. This is used to build an inventory of Aurora Clusters.
The Operator is designed to be highly configurable, granting flexibility to deploying in environments that differ in volume of metrics and logs, database authentication methods, and number of Aurora Clusters. Toggles and environmental variables allow the Operator to be deployed in environments for Development, Quality Assurance, Performance, and Production without any changes to the code itself.
Managing Logging and Monitoring Deployments
To manage logging and monitoring of all Aurora Clusters throughout each cluster’s life cycle, the Operator uses AWS boto3 [4] to keep track of each Aurora Cluster. It will monitor the life cycle state of each Aurora Cluster and instrument logging and monitoring appropriately. It will provision a pod once an Aurora Cluster is live for intended use, update configuration if changes are required, and remove the pod once the Aurora Cluster is deliberately decommissioned. In short, decisions on provisioning Kubernetes resources are highly dependent on the state of the concerned Aurora Clusters. Fig 8 shows this process in more detail.
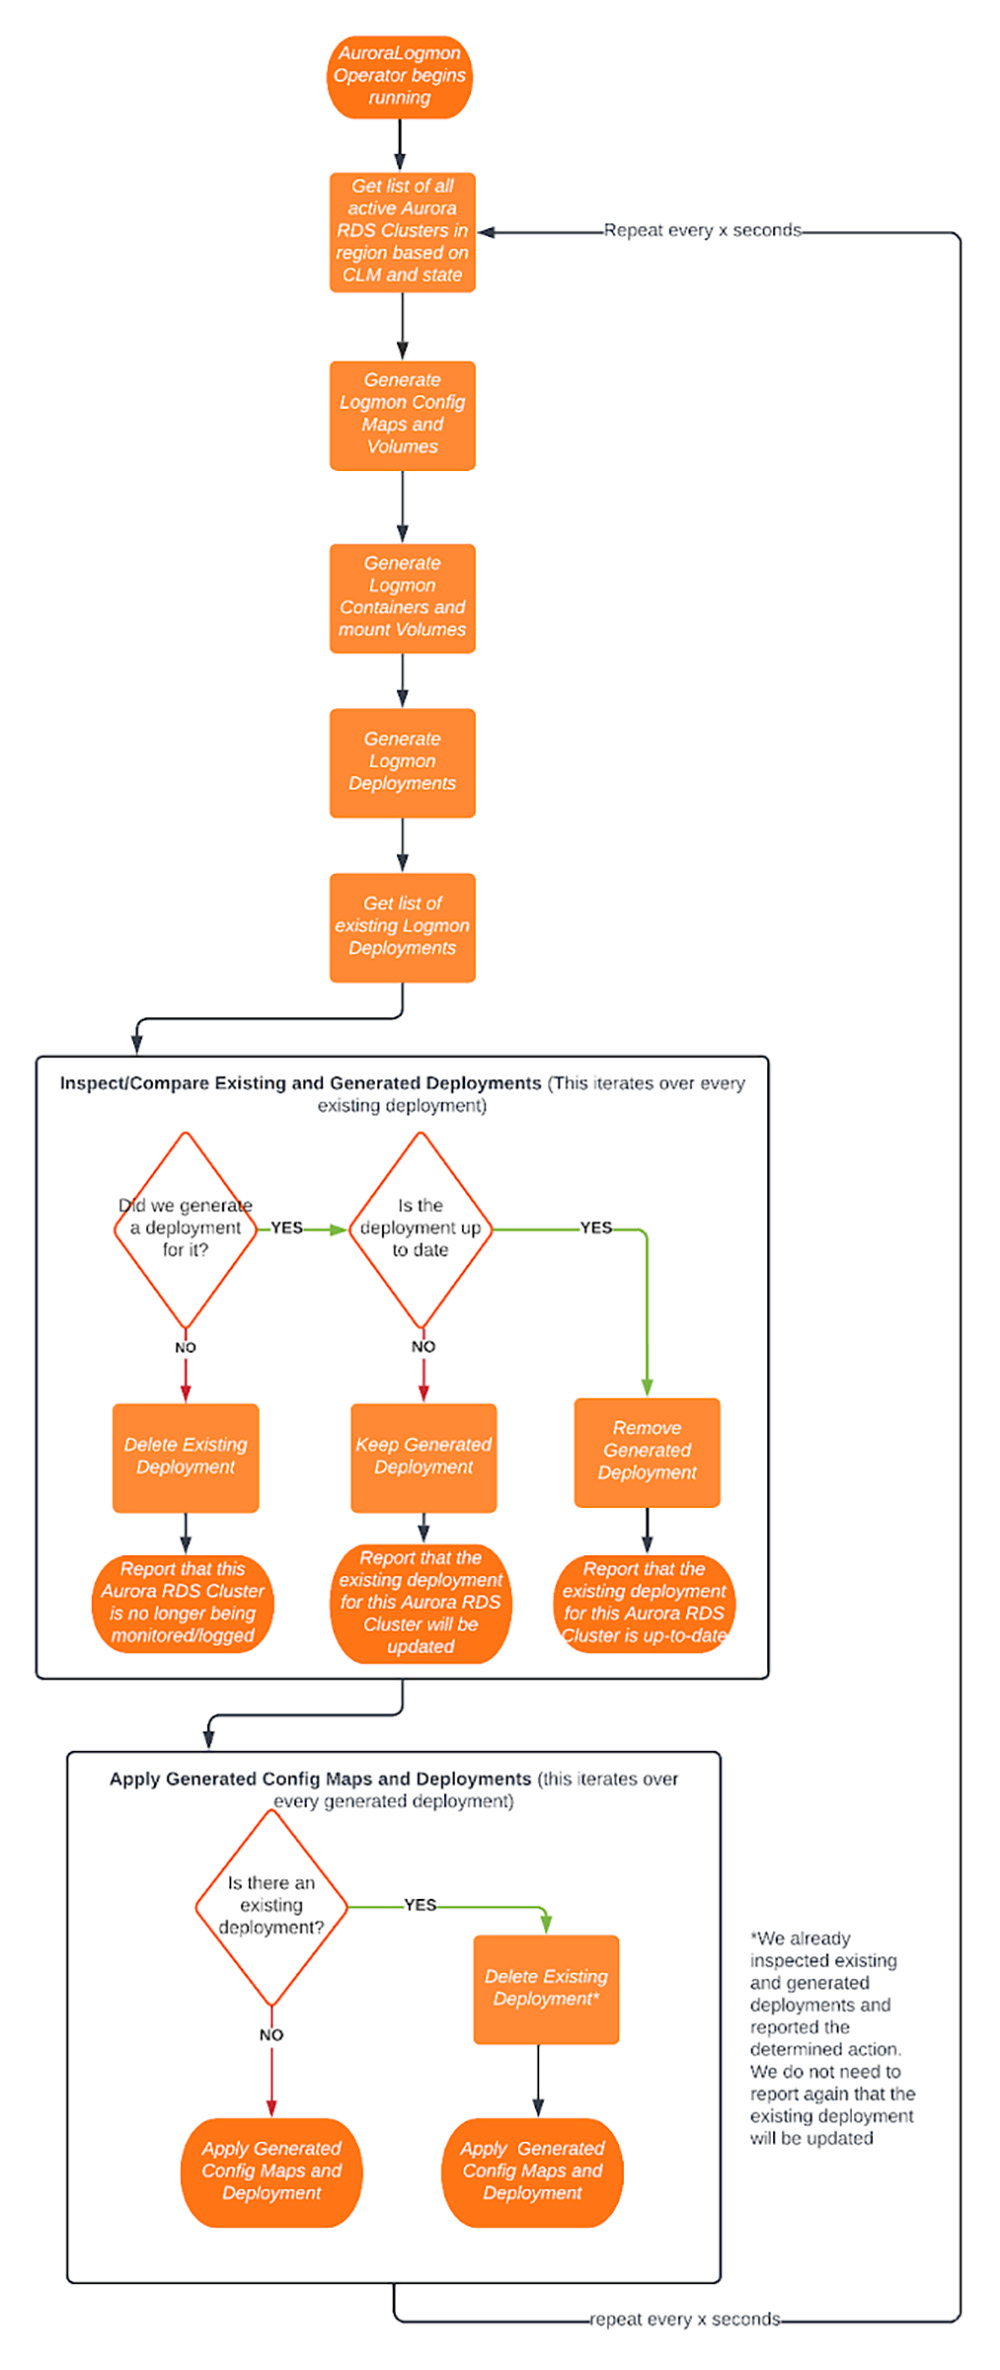
Fig 8: Operator Process in Detail
Fig 8 illustrates how the Operator manages logging and monitoring deployments. Information of Aurora from boto3 [4] informs the Operator on when deployments should be created, updated, and deleted. The resulting decision is then reported to our observability platform.
The Operator uses and extends the Kubernetes API through an Object Oriented approach. Classes on Deployments, ConfigMaps, Containers, and more are extended to aid the Operator in managing Logging and Monitoring deployments. An example use case is extending ConfigMap to help us detect when existing ConfigMap are in need of updates.
Through the Kubernetes API, the Operator can update the logging and monitoring of all Aurora clusters and configure how to update rollouts and rollbacks are executed for each deployment [10]. This is critical to reduce downtime between updates and have assurance that if an update fails, the deployment will be rolled back. Importantly, it reports when and why Aurora logging/monitoring deployments are created, updated, and deleted.
Automation of logging and monitoring through the lifecycle of each Aurora cluster is achieved by the Operator.
Cost Optimization
The Operator will remove pods whenever an Aurora cluster is decommissioned, freeing up resources and allowing nodes hosting the Kubernetes Cluster to scale down. Furthermore, resource requests are specified at the container level, allowing us to determine what type of machines are best suited for our Kubernetes cluster. By hosting the Kubernetes cluster on Amazon’s Elastic Kubernetes Service, autoscaling is leveraged to scale the cluster up and down depending on resource consumption [11]. This ensures the correct amount of resources are being used.
Conclusion
This article presents our design approach for the observability platform for Amazon Aurora, also presenting monitoring and logging operator capability.
Authors: Sandesh Achar, Nathaniel Louis Tisuela.
References:
- https://docs.aws.amazon.com/AmazonRDS/latest/AuroraUserGuide/metrics-reference.html
- https://docs.aws.amazon.com/AmazonRDS/latest/AuroraUserGuide/metrics-reference.html
- https://kubernetes.io/docs/concepts/extend-kubernetes/operator/
- https://boto3.amazonaws.com/v1/documentation/api/latest/reference/services/rds.html
- https://www.elastic.co/guide/en/beats/filebeat/current/filebeat-input-aws-cloudwatch.html
- https://www.influxdata.com/integration/aws-cloudwatch-statistics/
- https://www.influxdata.com/blog/monitoring-your-postgresql-database-with-telegraf-and-influxdb/
- https://kubernetes.io/docs/concepts/configuration/manage-resources-containers/
- https://artifacthub.io/packages/helm/influxdata/telegraf-ds
- https://kubernetes.io/docs/concepts/workloads/controllers/deployment/
- https://docs.aws.amazon.com/eks/latest/userguide/autoscaling.html


