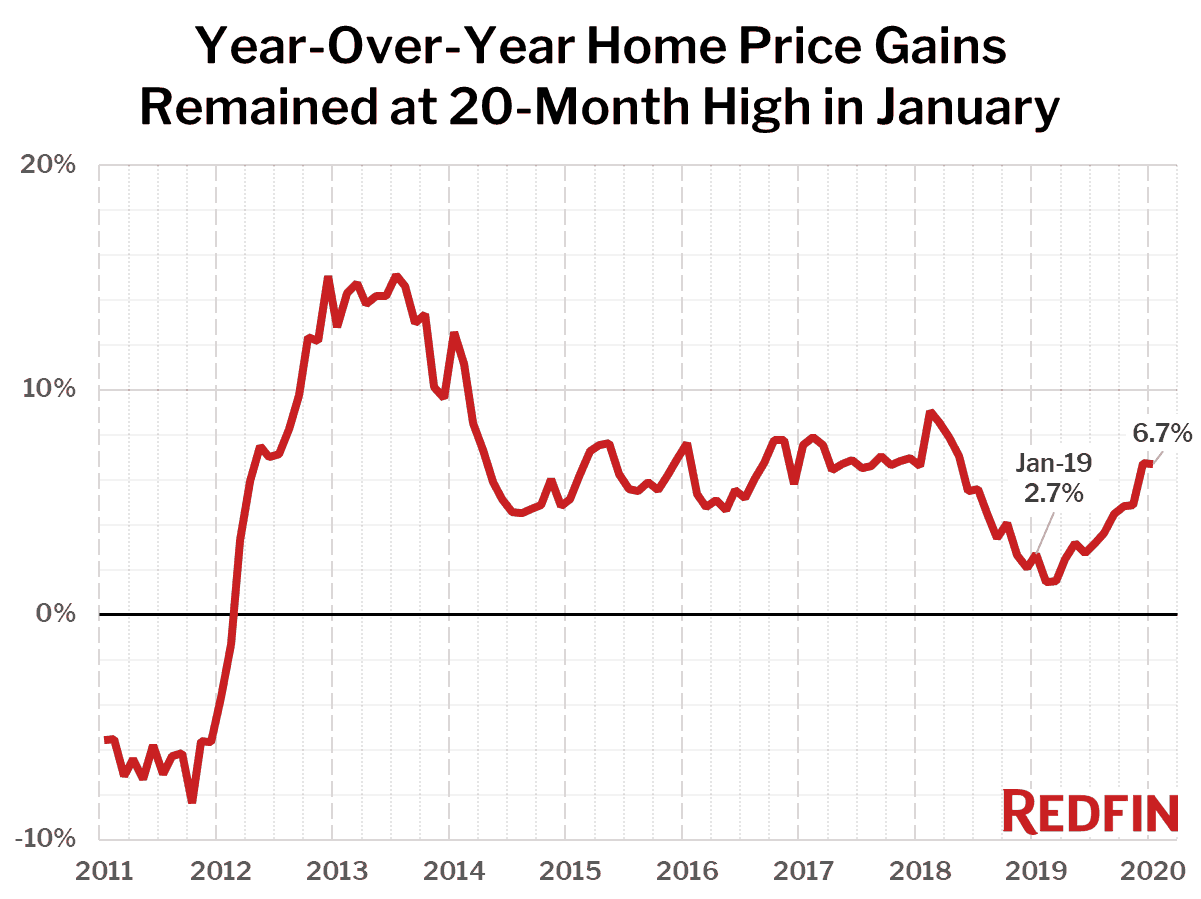
U.S. home-sale prices increased 6.7% year over year in January to a median of $306,400, according to a new report from Redfin (www.redfin.com), the technology-powered real estate brokerage. Home prices were also up 0.7% month over month on a seasonally-adjusted basis.
The most affordable metro areas continued to experience the biggest gains in home prices in January. Among the 20 metro areas with the largest year-over-year price increases, 18 had prices below the national median, led in January by Memphis (median price $182,900, up 17.1%), Dayton, OH ($132,000, +14.8%) and Rochester, NY ($148,500, +13.3%).
That said, low inventory is causing a crunch in many markets across the country, even the expensive coastal cities.
“Every home is getting multiple offers, often going for substantially above the asking price,” said San Fernando Valley Redfin agent Robert Iles. “One offer I recently submitted for a client faced competition from 23 other offers, and that was when the seller’s counteroffer included the term requiring our offer to be no less than $100,000 above the list price.”
“Buyers are getting pretty upset about the lack of inventory,” said Seattle Redfin agent Pauline Corbett. “There’s a growing sense of desperation as bidding wars stretch out their home searches.”
Of the 85 largest metro areas Redfin tracks, only three saw a year-over-year decline in the median sale price: San Jose (-4.3%), Baton Rouge (-4.1%) and Greenville, SC (-1.4%).
| Market Summary | January 2020 | Month-Over-Month | Year-Over-Year |
|---|---|---|---|
| Median sale price | $306,400 | -1.7% | 6.7% |
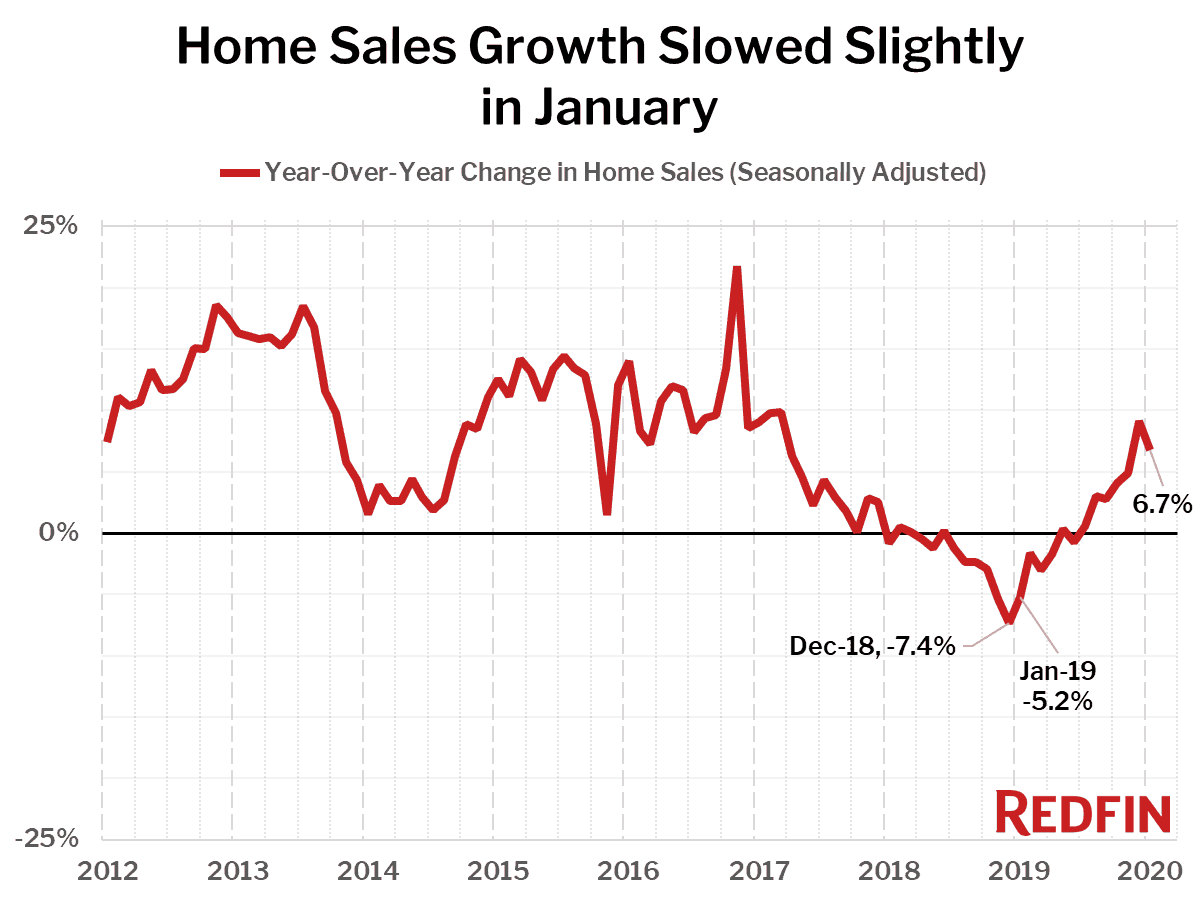
| Homes sold, seasonally-adjusted | 277,500 | -1.1% | 6.7% |
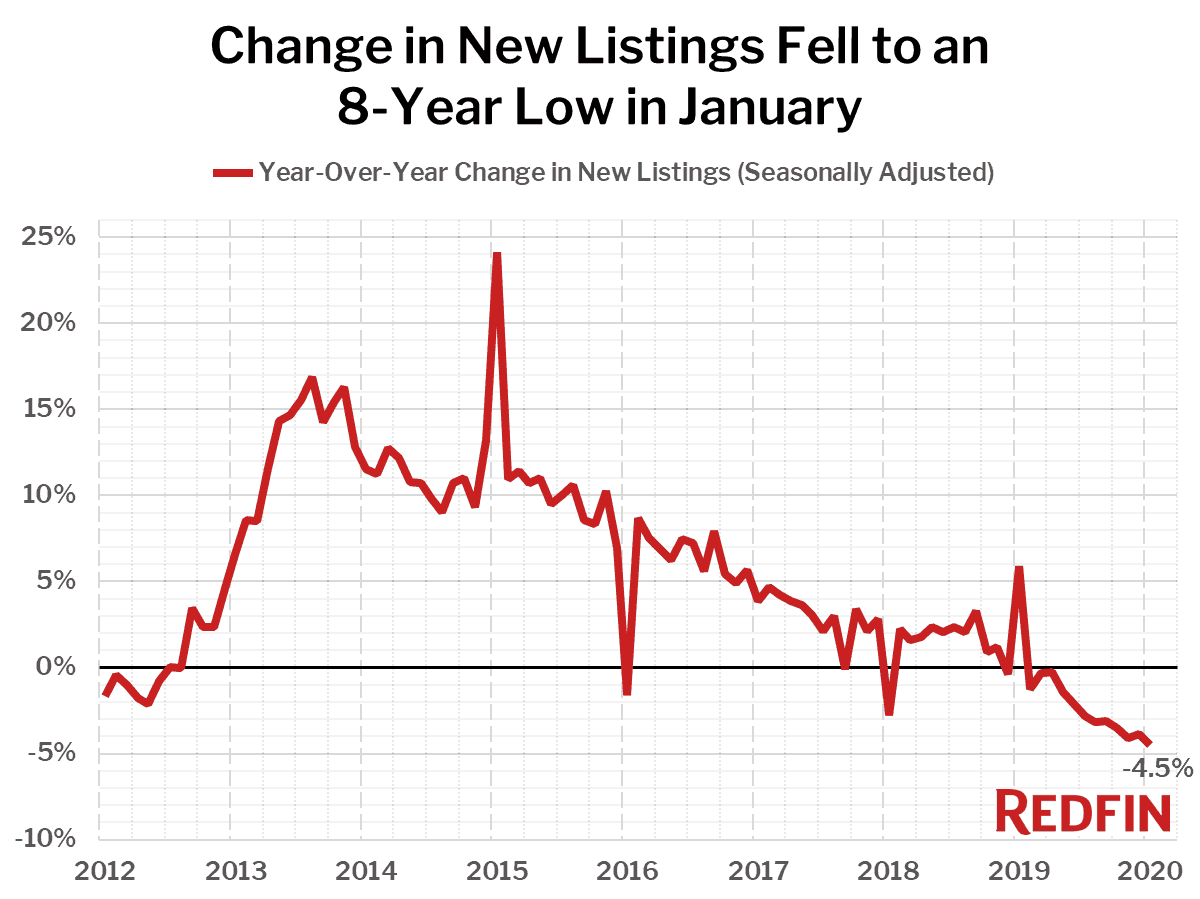
| New listings, seasonally-adjusted | 311,400 | -0.4% | -4.5% |
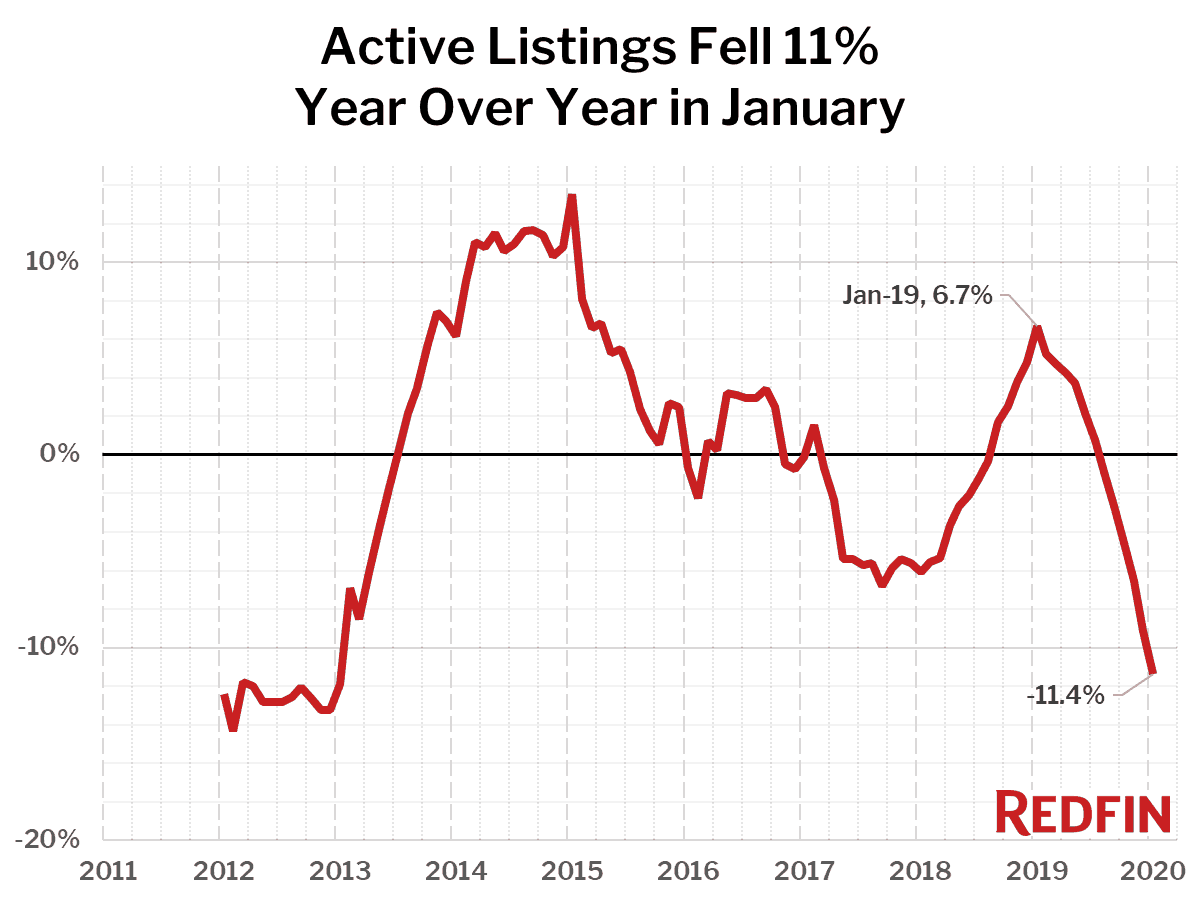
| Active listings during the month, seasonally-adjusted | 1,061,700 | -1.6% | -11.4% |
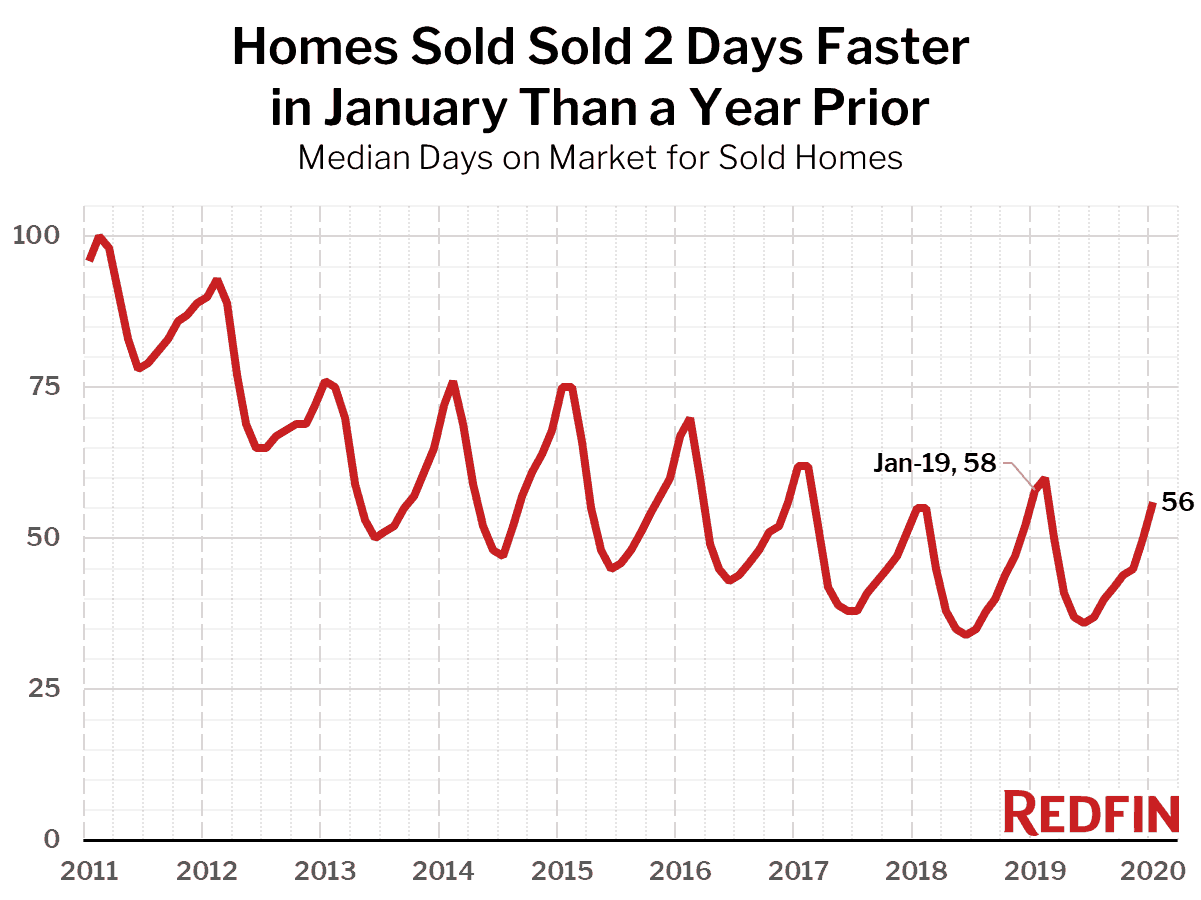
| Median days on market | 56 | 6 | -2 |
| Months of supply | 3.5 | 1 | -1 |
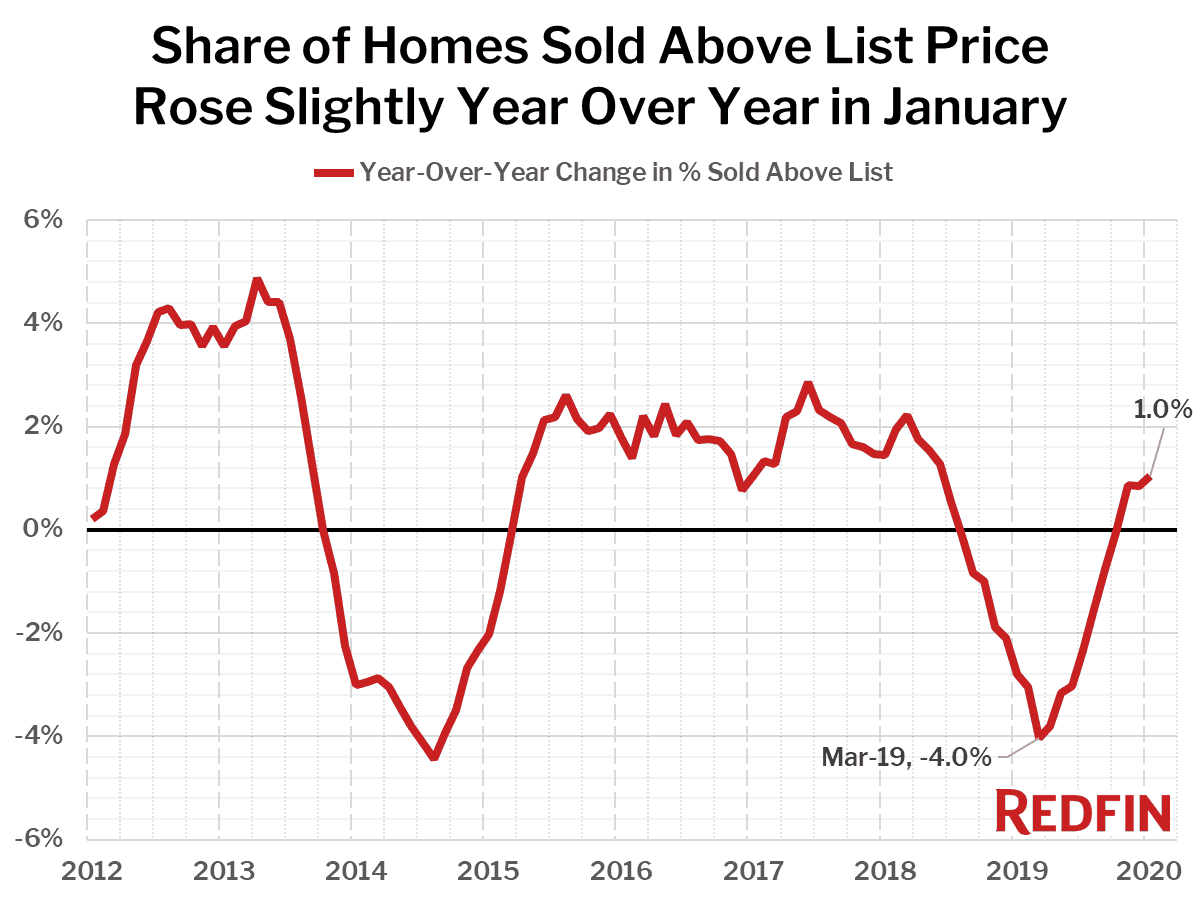
| Sold above list | 18.7% | -1.0 pts† | 1.0 pts† |
| Median Off-Market Redfin Estimate | $297,100 | 4.7% | 3.0% |
| Average Sale-to-list | 97.7% | -0.2 pts† | 0.3 pts† |
† – “pts” = percentage point change
Nationwide, home sales increased 6.7% year over year in January, the sixth consecutive month of increases, but were down 1.1% from December on a seasonally-adjusted basis.
“Typically, we don’t see this many buyers in January, but with mortgage rates at a 3-year low, there are plenty of early-birds hoping to secure a home and lock in an affordable mortgage payment,” said Redfin chief economist Daryl Fairweather. “Home sellers, on the other hand, see that the market is clearly heating up and have no reason to rush to list their homes or to make price cuts in order to secure a sale. Back in December, it wasn’t clear if demand would pick up in the new year, so some sellers were willing to accept lower prices, which borrowed some demand from January and resulted in the slight dip in sales we’re seeing now.”
The markets with the biggest increases in home sales from a year ago were North Port, FL (29.9%), Las Vegas (23.8%) and Anaheim, CA (23.2%).
This month Redfin introduced a new measure of housing supply called “active listings,” which is a count of all homes that were for sale at any time during the month. This is opposed to “inventory” which is a count of only the homes for sale on the last day of the month.
The active listings of homes for sale during January fell 11.4% year over year, the biggest decline since March 2013 and the sixth straight month of declines. There were fewer homes for sale last month than any time since January 2013. None of the 85 largest metros tracked by Redfin posted a year-over-year increase in the count of seasonally-adjusted active listings of homes for sale.
Compared to a year ago, the biggest declines in active housing supply in January were in Salt Lake City (-49.5%), Allentown, PA (-33.1%) and Kansas City, MO (-28.9%).
The number of new listings also fell in January, down 4.5% from a year earlier. Seasonally-adjusted new listings in December fell the most from a year earlier in Salt Lake City (-39.8%), followed by Allentown, PA (-30.8%) and St. Louis, MO (-27.8%).
Homes sold in January spent two fewer days on market compared to the prior year. In January, the typical home went under contract in 56 days, compared to 58 days in January 2019.
The share of homes that sold above list price increased 1.1 percentage point year over year, coming in at 18.7% in January compared to 17.6% a year earlier.