


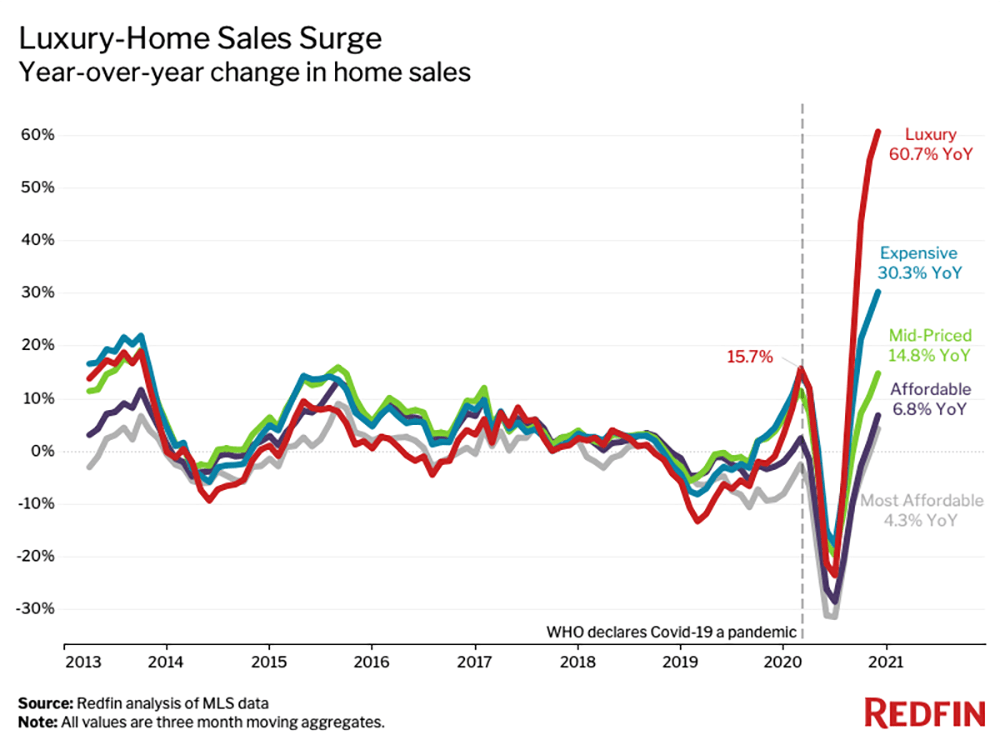
U.S. luxury home sales surged 60.7% year over year during the three months ending Nov. 30, the biggest jump since at least 2013, according to a new report from Redfin, the technology-powered real estate brokerage. That nearly quadrupled the growth seen during the three months ending Feb. 29, before the coronavirus was declared a pandemic. It also far outpaced the 14.8% increase in sales of mid-priced homes and the 6.8% uptick in sales of affordable homes, as America’s “K-shaped” economic recovery put more money into the pockets of the country’s wealthiest homebuyers.
The report is based on an analysis that divided all U.S. residential properties into five price tiers based on Redfin Estimates of the homes’ market values.
As the U.S. unemployment rate has declined, sales of affordable homes have made a comeback after plunging around 30% in the spring. But growth in this segment still pales compared to growth in the luxury tier, as high-earning Americans take advantage of stock-market gains, record-low mortgage rates, and the flexibility to work from anywhere, said Redfin Chief Economist Daryl Fairweather.
“Low- and middle-income Americans aren’t out of the woods when it comes to this recession. Affluent Americans are out of the woods, and they’re at their beach houses sipping margaritas,” Fairweather said. “When times are tough, banks are most likely to dole out home loans to the people who need them the least.”
The 49 most populous U.S. metropolitan areas experienced at least double-digit growth in luxury-home sales during the three months ending Nov. 30. The biggest jump was in Newark, NJ, where sales of luxury homes skyrocketed 101.6% year over year. It was followed by West Palm Beach, FL, up 97.1%, and San Antonio, TX, up 82.4%. Riverside, CA and Jacksonville, FL rounded out the top five, both up about 80%. Even Cincinnati—the market with the slowest growth rate—saw luxury sales rise 16.7%.
“Americans are pouring money into their homes. Sometimes that means remodeling, and sometimes it means purchasing a luxury beach house in Florida,” said Delray Valle, Redfin’s market manager in Palm Beach. “We’ve always seen luxury buyers come to West Palm Beach from New York and California, but this year, they’re also coming from Maryland, Las Vegas, Chicago, and other midwestern states. Florida is normally a second-home state, but now it’s shifting to a primary-home state.”
With affluent Americans on the move, the market for vacation homes—many of which are luxury properties—has been on fire. Demand for second homes soared 100% year over year in October, surpassing the 50% increase in demand for primary homes. And many of the country’s hottest neighborhoods, such as Lake Tahoe and the Lakes Region of New Hampshire, are popular resort destinations full of high-end houses.
|
Luxury |
Expensive |
Mid-Priced |
Affordable |
Most Affordable |
|
|
Homes sold, YoY change |
60.7% |
30.3% |
14.8% |
6.8% |
4.3% |
|
Median sale price |
$899,000 |
$412,000 |
$264,000 |
$180,000 |
$94,500 |
|
Median sale price, YoY change |
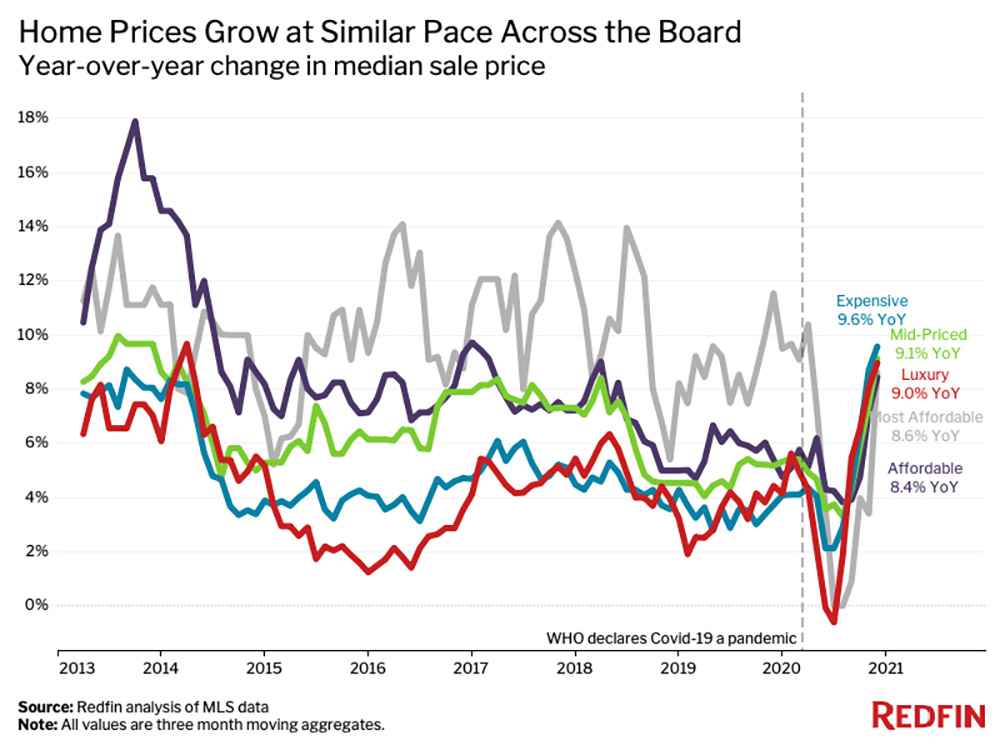
9.0% |
9.6% |
9.1% |
8.4% |
8.6% |
|
Number of homes for sale, YoY change |
2.3% |
-8.7% |
-10.2% |
-7.5% |
-2.7% |
|
New listings, YoY change |
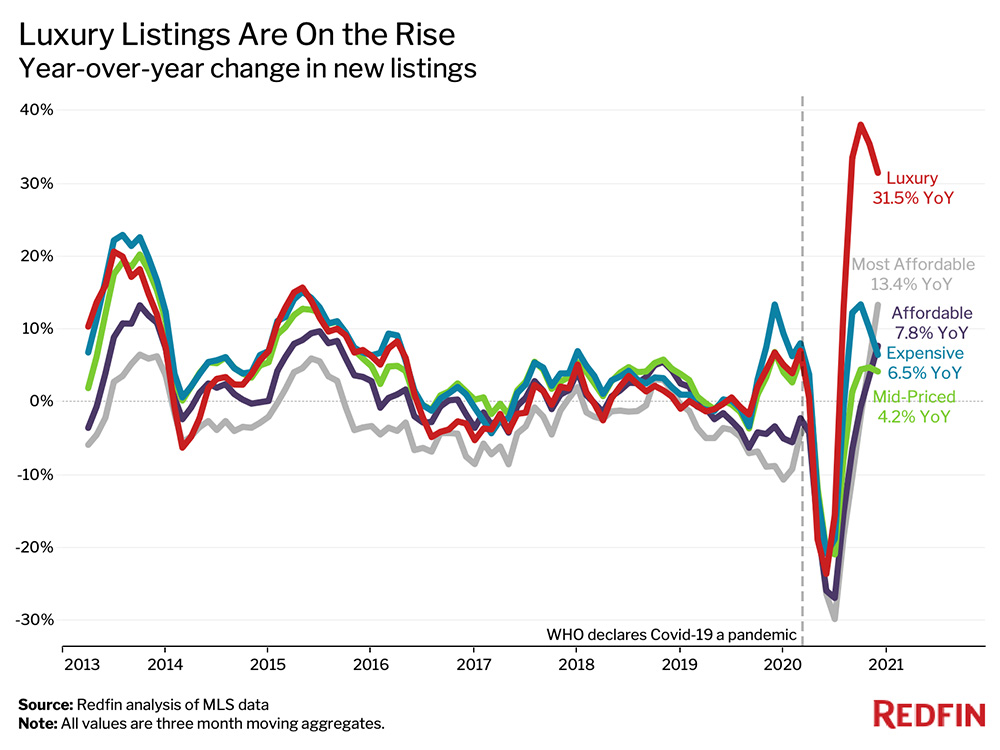
31.5% |
6.5% |
4.2% |
7.8% |
13.4% |
|
Median days on market |
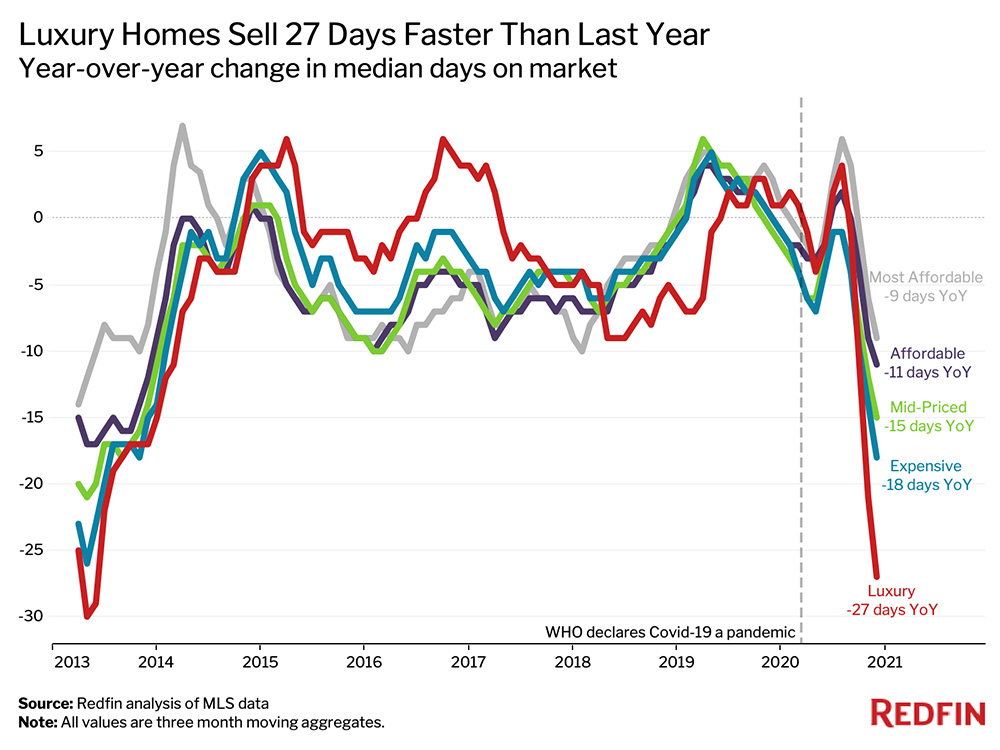
55 (-27 days YoY) |
33 (-18 days YoY) |
23 (-15 days YoY) |
24 (-11 days YoY) |
31 (-9 days YoY) |
An Expanding Supply of Luxury Homes Is Allowing Sales to Flourish
The number of luxury homes for sale climbed 2.3% year over year during the three months ending Nov. 30, while the supply of homes in all other price tiers declined.
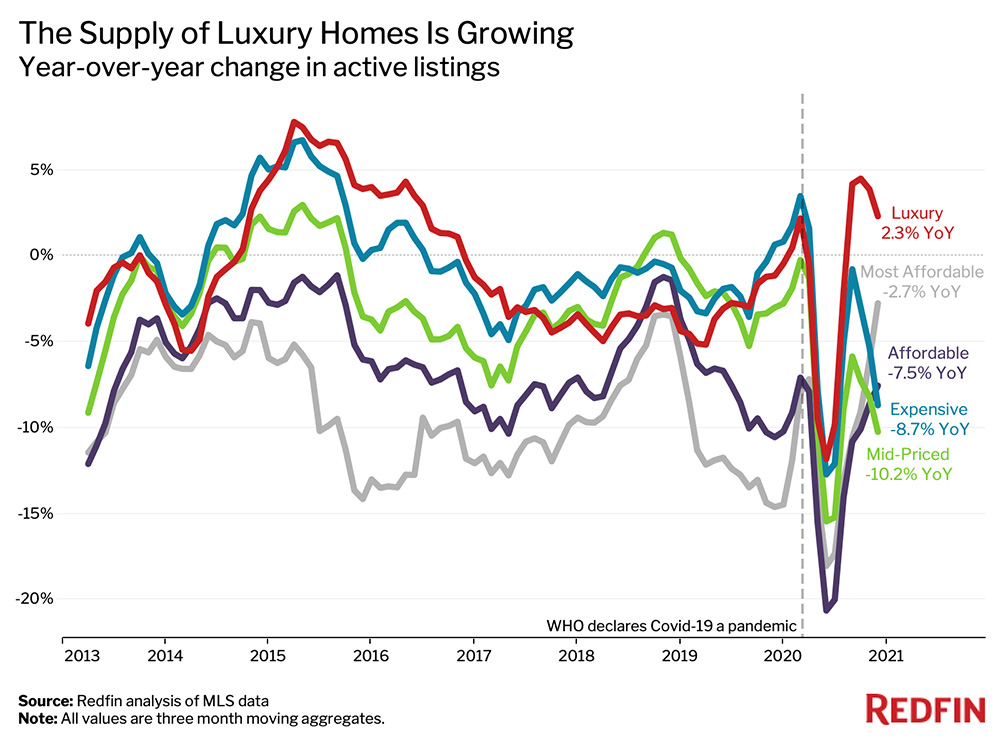
The growing supply of luxury homes is one factor supporting surging luxury-home sales. Luxury inventory is on the rise in part because affluent homeowners have had the means to put their homes up for sale and move elsewhere during the pandemic. New listings of luxury homes jumped 31.5% during the three months ending Nov. 30, more than double the growth of any other price tier.
Luxury-home supply will likely continue to expand, especially as builders ramp up construction, Fairweather said. U.S. building permits rose 8.5% year over year in November to a seasonally-adjusted annual rate of 1.6 million, and Fairweather believes builders will increasingly focus on luxury homes.
Meanwhile, the supply of affordable homes may keep growing at a relatively slow pace, at least until the pandemic is over; the owners of those homes are more likely to stay put as a result of financial uncertainty and federal forbearance policies that allow Americans to remain in their homes even if they can’t pay their mortgages.
Price Growth Converges for Luxury and Affordable Homes
Up until the coronavirus pandemic, affordable home prices increased faster than the prices of high-end homes. Now, prices across all tiers are growing at a similar rate.
The most affordable bucket of homes saw prices grow 8.6% during the three months ending Nov. 30, comparable to the luxury tier’s 9.0% growth. That’s a much smaller gap than during the three months ending Feb. 29, when prices of the most affordable homes were up 9.1%, versus growth of just 4.9% for luxury homes.
Luxury price growth has caught up to affordable price growth due to increasing competition in the luxury market, Fairweather said.
One indication of competition is how quickly homes are selling. The typical luxury home for sale during the three months ending Nov. 30 spent 55 days on the market—27 fewer days than the same period a year earlier. That compares with 15 fewer days for mid-priced homes and 11 fewer days for affordable homes.
*Excludes New York City
Methodology
Redfin divided all U.S. residential properties into five buckets. There are three equal-sized tiers based on Redfin Estimates of the homes’ market values as of Dec. 15, 2020, and tiers for the bottom 5% and top 5% of the market. The top 5% of the market by price is considered “luxury” for this report, while the bottom 5% is titled “most affordable.” The “affordable” tier is homes estimated to be in the 5th-35th percentile. The “mid-priced” tier represents homes estimated to be in the 35th-65th percentile. The “expensive” tier represents homes estimated to be in the 65th-95th percentile. By using Redfin Estimates of homes’ market value, Redfin used the same group of homes to report on price, sales, and inventory.


