


U.S. job switching rate declines 2.0 percentage points since the start of the pandemic in March 2020, while wages for U.S. workers grew 5.9 percent over the last year, increasing the average wage level by $1.71 to $30.84 an hour according to the ADP Research Institute Workforce Vitality Report (WVR). Employment growth demonstrated a continued downward slide by -7.0 percent. The average wage growth is higher than expected as a result of significant job losses among low wage earners, which increased the average.
“The significance of this data is a pre- and post-pandemic assessment of the labor market, from March 2020 compared to one year later in March 2021,” said Nela Richardson, chief economist, ADP. “Our data shows a decline in job switching, pointing to the pandemic’s effect on worker sentiment of the job market. This decline in job switching shows workers staying put, perhaps apprehensive to make the switch or rather, embracing existing job opportunities brought on by the pandemic such as promotions and additional responsibilities, likely another reason to hold their current job. As the workforce moves beyond the one-year mark, we’ll be keeping a close watch on how job switching behaviors change and evolve as the economy rebounds.”
Employment growth year-over-year continued a downward slide with -7.0 percent due to COVID-19, yet at a slightly slower pace than we have seen in past months. Individual industry employment trends were unchanged with leisure and hospitality remaining as the hardest hit and the finance industry the least impacted. Additionally, the leisure and hospitality and trade sectors both show larger wage growth over other sectors, due to greater loss of low wage job in these sectors.
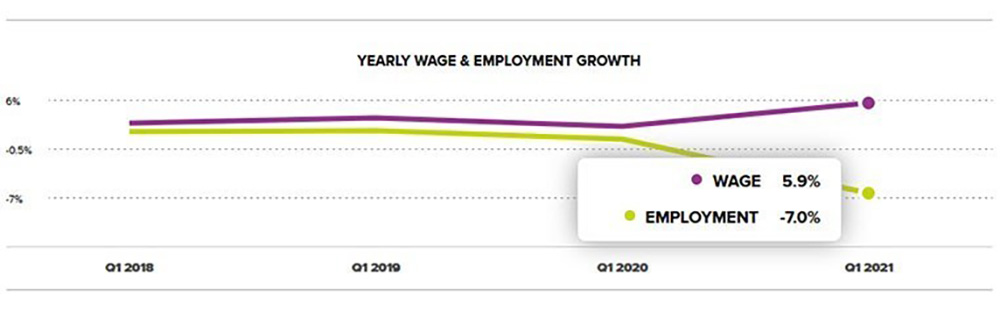
Chart 1: Yearly Wage & Employment Growth – March 2021, according to the ADP Workforce Vitality Report by the ADP Research Institute.
Table 1: Wage and Employment Growth by Industry – March 2021
|
Industry |
Wages |
YOY Wage Growth |
Yearly Growth |
||||
|
All |
Holders |
Entrants |
Switchers |
Employment |
Switching |
||
|
-ALL- |
$30.84 |
5.9% |
4.5% |
6.2% |
4.9% |
-7.0% |
18.8% |
|
Goods |
|||||||
|
Construction |
$30.68 |
4.1% |
4.5% |
7.4% |
4.3% |
-2.4% |
12.9% |
|
Manufacturing |
$31.90 |
4.8% |
4.2% |
5.6% |
5.8% |
-4.3% |
16.2% |
|
Resources and Mining |
$39.75 |
13.6% |
2.9% |
0.0% |
12.9% |
-11.5% |
4.7% |
|
Services |
|||||||
|
Information |
$44.81 |
4.1% |
4.0% |
9.3% |
9.4% |
-11.0% |
19.3% |
|
Finance and Real Estate |
$36.11 |
4.8% |
4.4% |
12.7% |
5.8% |
-1.7% |
15.2% |
|
Professional and Business Services |
$38.93 |
5.3% |
4.0% |
8.0% |
8.4% |
-5.5% |
21.4% |
|
Education and Health Services |
$28.82 |
4.8% |
4.0% |
5.9% |
3.9% |
-4.0% |
17.8% |
|
Leisure and Hospitality |
$19.22 |
7.8% |
5.9% |
2.5% |
-1.0% |
-22.4% |
21.2% |
|
Trade, Transportation, and Utilities |
$27.24 |
5.7% |
4.7% |
5.3% |
1.1% |
-4.6% |
22.3% |
Regionally, wage growth has been consistently higher in the Northeast followed by the West. Though employment growth is still negative across all regions, the West saw the least impact. Job switchers also fared better in the Northeast and the West with wage growth of 6.9 and 5.9 percent respectively. By firm size, larger firms did better both from wage and employment perspective compared to small businesses.
Table 2: Wage and Employment Growth by Region and Firm Size – March 2021
|
Region |
Wages |
YOY Wage Growth |
Yearly Growth |
||||
|
All |
Holders |
Entrants |
Switchers |
Employment |
Switching Rate |
||
|
-USA- |
$30.84 |
5.9% |
4.5% |
6.2% |
4.9% |
-7.0% |
18.8% |
|
MIDWEST |
$28.49 |
4.9% |
4.4% |
7.0% |
2.2% |
-7.6% |
17.6% |
|
NORTHEAST |
$35.18 |
7.2% |
4.4% |
8.2% |
6.9% |
-9.9% |
19.6% |
|
SOUTH |
$28.48 |
5.0% |
4.3% |
6.8% |
4.8% |
-5.9% |
19.0% |
|
WEST |
$33.51 |
6.7% |
4.9% |
4.7% |
5.9% |
-5.7% |
19.1% |
|
Company Size |
|||||||
|
-ALL- |
$30.84 |
5.9% |
4.5% |
6.2% |
4.9% |
-7.0% |
18.8% |
|
49 or less |
$27.93 |
4.7% |
4.4% |
6.4% |
3.7% |
-8.7% |
14.0% |
|
50 to 499 |
$30.96 |
5.8% |
4.2% |
5.5% |
5.1% |
-8.7% |
20.0% |
|
500 to 999 |
$31.53 |
4.0% |
4.7% |
5.4% |
2.4% |
-5.0% |
18.5% |
|
1000 or more |
$32.33 |
6.7% |
4.7% |
5.9% |
5.9% |
-5.0% |
21.3% |
Job switching declined on average by 2.0 percentage points across all industries; however, there were some differences among industries. Job switching in the finance sector declined by 2.0 percentage points, whereas leisure and hospitality declined by almost 4.0 percentage points. This practically double percentage point drop in job switching is due to the significant job loss in leisure and hospitality which limited job opportunities to switch into that industry.
The distribution of job switchers across gender remained the same from pre-pandemic to now. While wages for male job switchers were higher overall, wage growth was higher for females. This is indicative of the lower wage levels females currently receive.
Table 3: Wage and Switching Rate by Industry and Gender – March 2021
|
Industry |
Gender |
Share |
Switching Rate |
Switching |
Switchers’ |
|
ALL |
Female |
48% |
19.6% |
$28.73 |
5.7% |
|
Male |
52% |
18.1% |
$34.41 |
4.5% |
|
|
Construction |
Female |
20% |
13.7% |
$26.97 |
5.2% |
|
Male |
80% |
12.7% |
$27.36 |
4.4% |
|
|
Manufacturing |
Female |
33% |
17.5% |
$39.17 |
7.1% |
|
Male |
67% |
15.6% |
$37.55 |
5.2% |
|
|
Finance & Real Estate |
Female |
55% |
15.1% |
$29.58 |
6.1% |
|
Male |
45% |
15.2% |
$43.51 |
6.2% |
|
|
Information |
Female |
38% |
19.5% |
$45.80 |
10.2% |
|
Male |
62% |
19.2% |
$56.90 |
9.5% |
|
|
Professional & Business Serv |
Female |
48% |
22.7% |
$38.47 |
7.7% |
|
Male |
52% |
20.4% |
$47.22 |
9.2% |
|
|
Education & Health |
Female |
78% |
18.4% |
$23.63 |
4.3% |
|
Male |
22% |
15.8% |
$31.81 |
3.3% |
|
|
Leisure & Hospitality |
Female |
54% |
21.1% |
$17.09 |
-2.5% |
|
Male |
46% |
21.4% |
$21.68 |
0.2% |
|
|
Trade, Transportation & Utilities |
Female |
39% |
23.8% |
$26.65 |
4.9% |
|
Male |
61% |
21.3% |
$27.32 |
-0.7% |
Compared to last year, the disparity in wages between male and females increased with age. The hourly wage for males is 7 percent higher for those 24-years-old and younger, whereas the hourly wage for males is 36 percent higher compared to females in the 55+ age group.
Table 3: Wages by Gender and Age – March 2021
|
24 or less |
25 to 34 |
35 to 54 |
55 or more |
-ALL- |
||
|
Employment Growth |
-ALL- |
-10.5% |
-8.6% |
-5.5% |
-5.4% |
-7.0% |
|
Female |
-8.7% |
-9.0% |
-6.8% |
-7.1% |
-7.7% |
|
|
Male |
-12.5% |
-8.3% |
-4.3% |
-3.9% |
-6.2% |
|
|
Wage Growth |
-ALL- |
5.1% |
5.6% |
5.6% |
5.4% |
5.9% |
|
Female |
6.9% |
6.5% |
6.9% |
6.0% |
6.8% |
|
|
Male |
3.7% |
4.9% |
4.6% |
4.8% |
5.2% |
|
|
Wage Level |
-ALL- |
$16.24 |
$26.17 |
$34.79 |
$35.06 |
$30.84 |
|
Female |
$15.65 |
$24.81 |
$30.71 |
$29.06 |
$27.20 |
|
|
Male |
$16.81 |
$27.33 |
$38.05 |
$39.66 |
$33.82 |
|
|
Males Earning More |
7% |
10% |
24% |
36% |
24% |
|


