S&P Dow Jones Indices (S&P DJI) released the latest results for the S&P CoreLogic Case-Shiller Indices, the leading measure of U.S. home prices. Data released for February 2021 show that home prices continue to increase across the U.S. More than 27 years of history.
Year-over-year
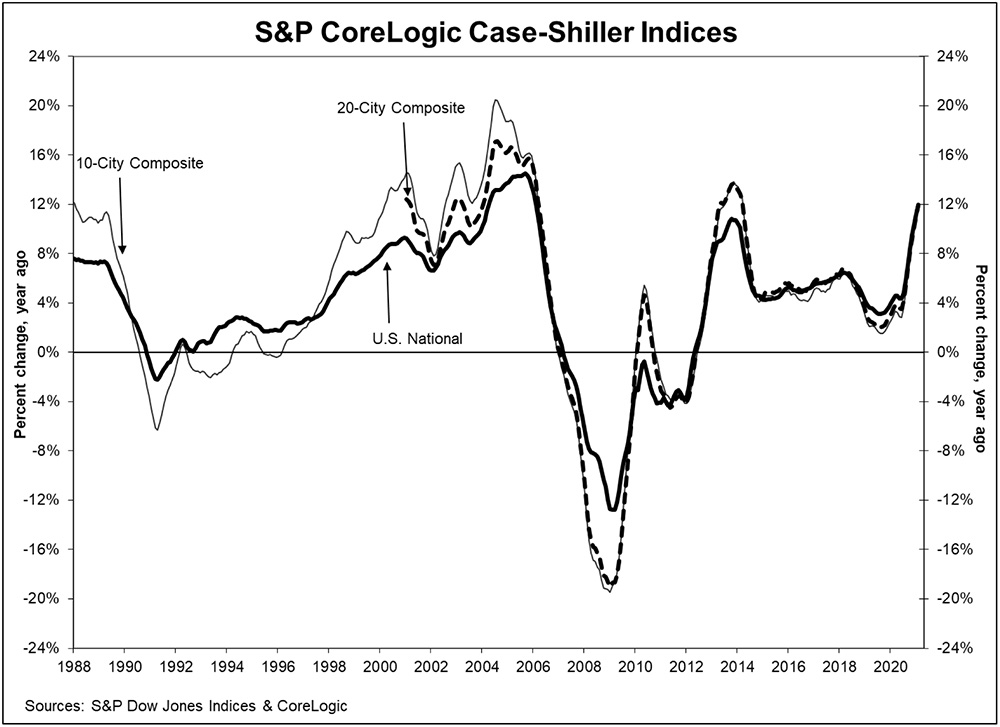
The S&P CoreLogic Case-Shiller U.S. National Home Price NSA Index, covering all nine U.S. census divisions, reported a 12.0% annual gain in February, up from 11.2% in the previous month. The 10-City Composite annual increase came in at 11.7%, up from 10.9% in the previous month. The 20-City Composite posted an 11.9% year-over-year gain, up from 11.1% in the previous month.
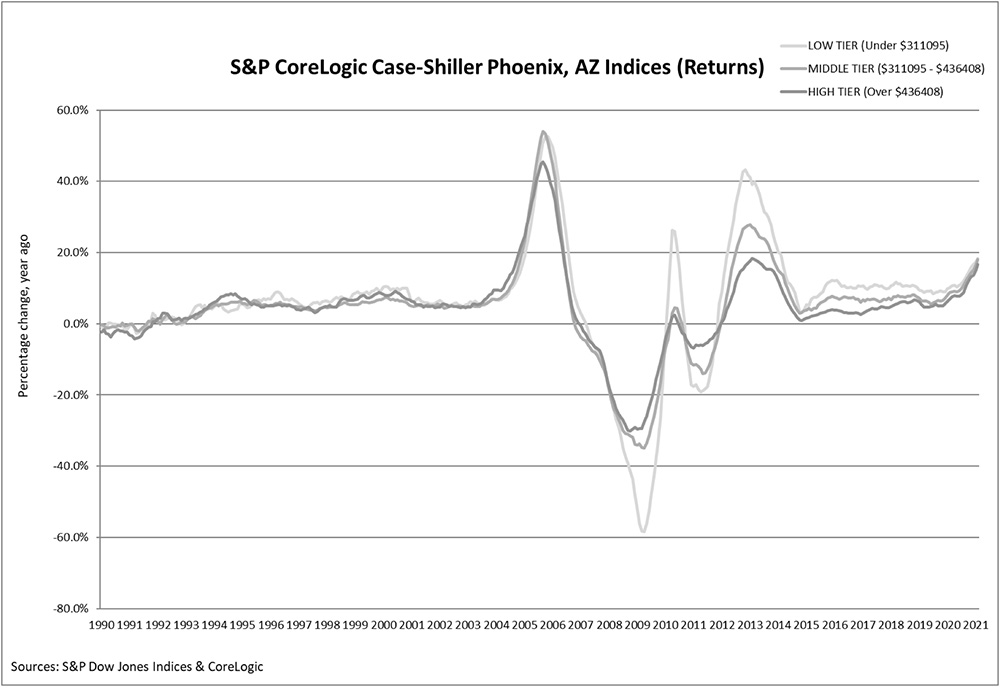
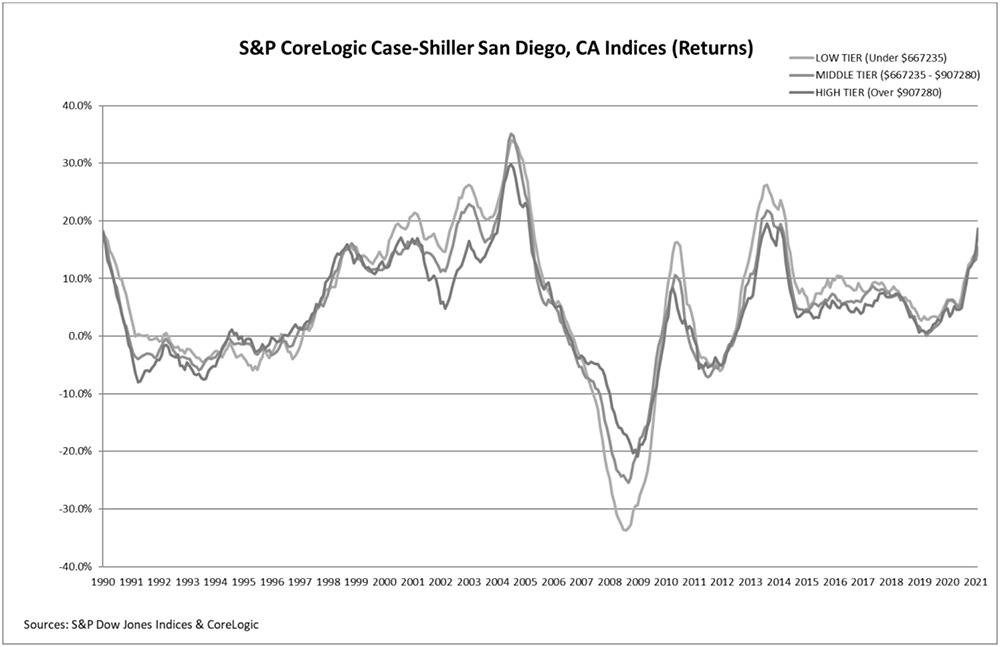
Phoenix, San Diego, and Seattle reported the highest year-over-year gains among the 20 cities in February. Phoenix led the way with a 17.4% year-over-year price increase, followed by San Diego with a 17.0% increase and Seattle with a 15.4% increase. Nineteen of the 20 cities reported higher price increases in the year ending February 2021 versus the year ending January 2021.
Month-over-month
Before seasonal adjustment, the U.S. National Index posted a 1.1% month-over-month increase, while the 10-City and 20-City Composites both posted increases of 1.1% and 1.2% respectively in February.
After seasonal adjustment, the U.S. National Index posted a month-over-month increase of 1.1%, and the 10-City and 20-City Composites both posted increases of 1.1% and 1.2% respectively as well. In February, all 20 cities reported increases before and after seasonal adjustments.
Analysis
“Strong home price gains continued in February 2021,” says Craig J. Lazzara, Managing Director and Global Head of Index Investment Strategy at S&P DJI. The National Composite Index marked its ninth month of accelerating prices with a 12.0% gain from year-ago levels, up from 11.2% in January. This acceleration is also reflected in the 10- and 20-City Composites (up 11.7% and 11.9%, respectively). The market’s strength continues to be broadly based: all 20 cities rose, and 19 cities gained more in the 12 months ended in February than they had gained in the 12 months ended in January.
“More than 30 years of S&P CoreLogic Case-Shiller data help us to put February’s results into historical context. The National Composite’s 12.0% gain is the highest recorded since February 2006, exactly 15 years ago, and lies comfortably in the top decile of historical performance. Housing’s strength is reflected across all 20 cities; February’s price gains in every city are above that city’s median level and rank in the top quartile of all reports in 18 cities.
“These data remain consistent with the hypothesis that COVID has encouraged potential buyers to move from urban apartments to suburban homes. This demand may represent buyers who accelerated purchases that would have happened anyway over the next several years. Alternatively, there may have been a secular change in preferences, leading to a permanent shift in the demand curve for housing. Future data will be required to analyze this question.
“Phoenix’s 17.4% increase led all cities for the 21st consecutive month, with San Diego (+17.0%) and Seattle (+15.4%) close behind. Although prices were strongest in the West (+13.0%) and Southwest (+12.9%), every region logged double-digit gains.”
Supporting data
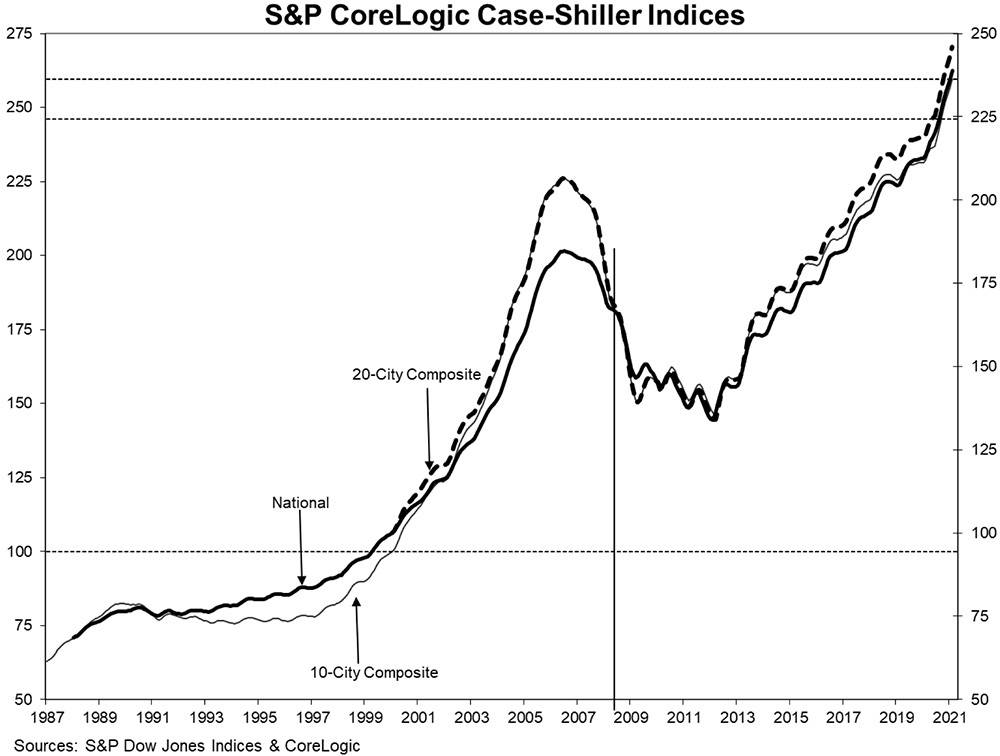
Table 1 below shows the housing boom/bust peaks and troughs for the three composites along with the current levels and percentage changes from the peaks and troughs.
|
2006 Peak |
2012 Trough |
Current |
||||||
|
Index |
Level |
Date |
Level |
Date |
From Peak (%) |
Level |
From Trough (%) |
From Peak (%) |
|
National |
184.61 |
Jul-06 |
133.99 |
Feb-12 |
-27.4% |
238.82 |
78.2% |
29.4% |
|
20-City |
206.52 |
Jul-06 |
134.07 |
Mar-12 |
-35.1% |
246.04 |
83.5% |
19.1% |
|
10-City |
226.29 |
Jun-06 |
146.45 |
Mar-12 |
-35.3% |
259.50 |
77.2% |
14.7% |
Table 2 below summarizes the results for February 2021. The S&P CoreLogic Case-Shiller Indices could be revised for the prior 24 months, based on the receipt of additional source data.
|
February 2021 |
February/January |
January ’21/December ’20 |
1-Year |
|||||
|
Metropolitan Area |
Level |
Change (%) |
Change (%) |
Change (%) |
||||
|
Atlanta |
171.44 |
0.9% |
0.8% |
10.0% |
||||
|
Boston |
254.42 |
0.9% |
0.7% |
13.7% |
||||
|
Charlotte |
187.36 |
1.0% |
0.7% |
11.7% |
||||
|
Chicago |
154.76 |
0.3% |
0.3% |
8.6% |
||||
|
Cleveland |
142.62 |
0.8% |
0.1% |
12.5% |
||||
|
Dallas |
214.38 |
1.7% |
0.8% |
10.9% |
||||
|
Denver |
250.39 |
1.8% |
1.0% |
11.2% |
||||
|
Detroit |
142.63 |
1.0% |
0.6% |
11.7% |
||||
|
Las Vegas |
214.78 |
1.0% |
0.9% |
9.1% |
||||
|
Los Angeles |
325.33 |
1.3% |
1.0% |
11.9% |
||||
|
Miami |
275.88 |
1.0% |
1.2% |
11.0% |
||||
|
Minneapolis |
198.56 |
1.0% |
0.0% |
10.4% |
||||
|
New York |
227.36 |
0.6% |
1.0% |
11.6% |
||||
|
Phoenix |
236.51 |
2.0% |
1.6% |
17.4% |
||||
|
Portland |
270.66 |
1.3% |
1.0% |
11.4% |
||||
|
San Diego |
310.62 |
2.9% |
1.5% |
17.0% |
||||
|
San Francisco |
298.34 |
2.1% |
0.6% |
11.0% |
||||
|
Seattle |
299.95 |
2.4% |
1.5% |
15.4% |
||||
|
Tampa |
255.05 |
1.3% |
1.1% |
12.7% |
||||
|
Washington |
262.18 |
1.0% |
0.7% |
11.1% |
||||
|
Composite-10 |
259.50 |
1.1% |
0.9% |
11.7% |
||||
|
Composite-20 |
246.04 |
1.2% |
0.9% |
11.9% |
||||
|
U.S. National |
238.82 |
1.1% |
0.9% |
12.0% |
||||
|
Sources: S&P Dow Jones Indices and CoreLogic |
||||||||
|
Data through February 2021 |
||||||||
Table 3 below shows a summary of the monthly changes using the seasonally adjusted (SA) and non-seasonally adjusted (NSA) data. Since its launch in early 2006, the S&P CoreLogic Case-Shiller Indices have published, and the markets have followed and reported on, the non-seasonally adjusted data set used in the headline indices. For analytical purposes, S&P Dow Jones Indices publishes a seasonally adjusted data set covered in the headline indices, as well as for the 17 of 20 markets with tiered price indices and the five condo markets that are tracked.
|
February/January Change (%) |
January ’21/December ’20 Change (%) |
|||||||
|
Metropolitan Area |
NSA |
SA |
NSA |
SA |
||||
|
Atlanta |
0.9% |
0.8% |
0.8% |
1.2% |
||||
|
Boston |
0.9% |
1.3% |
0.7% |
1.3% |
||||
|
Charlotte |
1.0% |
1.0% |
0.7% |
1.1% |
||||
|
Chicago |
0.3% |
0.4% |
0.3% |
0.8% |
||||
|
Cleveland |
0.8% |
1.2% |
0.1% |
0.9% |
||||
|
Dallas |
1.7% |
1.4% |
0.8% |
1.2% |
||||
|
Denver |
1.8% |
1.4% |
1.0% |
1.1% |
||||
|
Detroit |
1.0% |
1.0% |
0.6% |
1.2% |
||||
|
Las Vegas |
1.0% |
1.1% |
0.9% |
1.3% |
||||
|
Los Angeles |
1.3% |
1.3% |
1.0% |
1.1% |
||||
|
Miami |
1.0% |
1.1% |
1.2% |
1.3% |
||||
|
Minneapolis |
1.0% |
1.1% |
0.0% |
0.8% |
||||
|
New York |
0.6% |
1.2% |
1.0% |
1.2% |
||||
|
Phoenix |
2.0% |
2.1% |
1.6% |
2.0% |
||||
|
Portland |
1.3% |
1.5% |
1.0% |
1.2% |
||||
|
San Diego |
2.9% |
2.2% |
1.5% |
1.5% |
||||
|
San Francisco |
2.1% |
1.5% |
0.6% |
1.4% |
||||
|
Seattle |
2.4% |
1.6% |
1.5% |
1.6% |
||||
|
Tampa |
1.3% |
1.3% |
1.1% |
1.4% |
||||
|
Washington |
1.0% |
1.0% |
0.7% |
1.1% |
||||
|
Composite-10 |
1.1% |
1.1% |
0.9% |
1.2% |
||||
|
Composite-20 |
1.2% |
1.2% |
0.9% |
1.2% |
||||
|
U.S. National |
1.1% |
1.1% |
0.9% |
1.3% |
||||
|
Sources: S&P Dow Jones Indices and CoreLogic |
||||||||
|
Data through February 2021 |
||||||||