


The Chemical Activity Barometer (CAB), a leading economic indicator created by the American Chemistry Council (ACC), fell 5.5 percent in April on a three-month moving average (3MMA) basis following a downwardly revised 2.9 percent decline in March. On a year-over-year (Y/Y) basis, the barometer fell 7.3 percent in April.
The unadjusted data shows a 6.7 percent decline in April following an 8.9 percent decline in March and a 1.0 percent decline in February. The diffusion index slumped from 47 percent to 35 percent in April. The diffusion index marks the number of positive contributors relative to the total number of indicators monitored. The CAB reading for March was revised downward by 1.04 points and that for February was revised upward by 0.07 points.
“The latest CAB reading is consistent with a recession,” said Kevin Swift, chief economist at ACC. “The declines of April and March are the most pronounced, pervasive and persistent in the post-World War II period.”
The CAB has four main components, each consisting of a variety of indicators: 1) production; 2) equity prices; 3) product prices; and 4) inventories and other indicators.
Production-related indicators generally declined in April. Trends in construction-related resins, pigments, and related performance chemistry were generally negative. Plastic resins used in packaging and for consumer and institutional applications were mixed. Performance chemistry was negative and U.S. exports were weak. Equity prices are improving. Product and input prices were negative. Inventory and other supply chain indicators were negative.
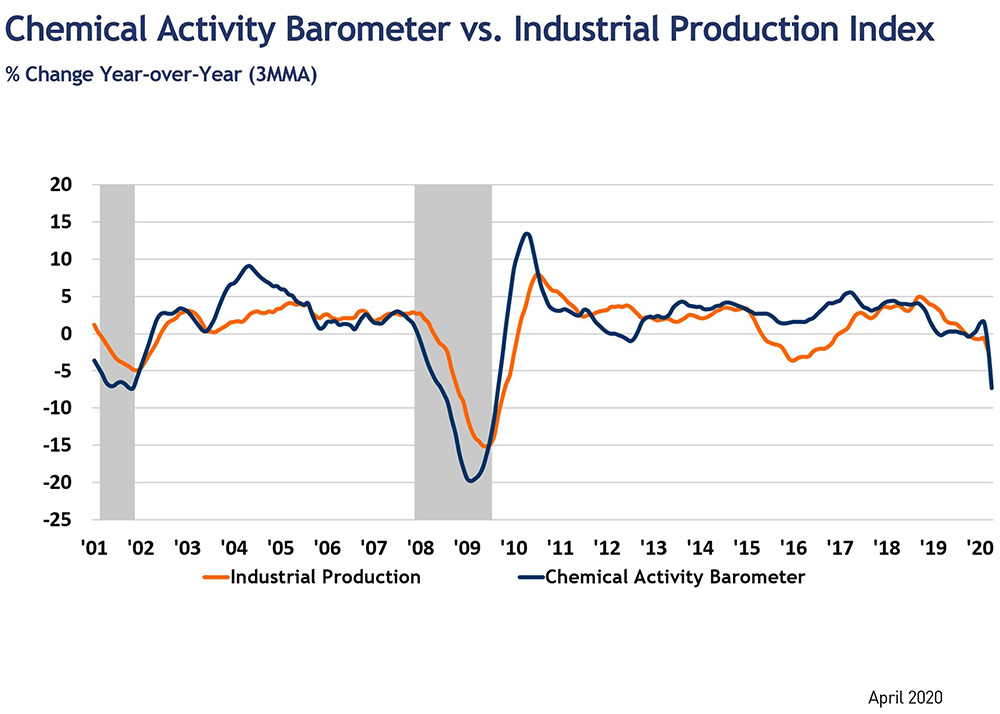
The CAB is a leading economic indicator derived from a composite index of chemical industry activity. Due to its early position in the supply chain, chemical industry activity has been found to consistently lead the U.S. economy’s business cycle, and this barometer can be used to determine turning points and likely trends in the broader economy. Month-to-month movements can be volatile, so a three-month moving average of the CAB reading is provided. This provides a more consistent and illustrative picture of national economic trends.
Applying the CAB back to 1912, it has been shown to provide a lead of two to 14 months, with an average lead of eight months at cycle peaks as determined by the National Bureau of Economic Research. The median lead was also eight months. At business cycle troughs, the CAB leads by one to seven months, with an average lead of four months. The median lead was three months. The CAB is rebased to the average lead (in months) of an average 100 in the base year (the year 2012 was used) of a reference time series. The latter is the Federal Reserve’s Industrial Production Index.
|
Chemical Activity Barometer for the Latest Six Months and Year-Ago Month* |
|||||||
|
Apr-19 |
Nov-19 |
Dec-19 |
Jan-20 |
Feb-20 |
Mar-20 |
Apr-20 |
|
|
CAB (3 MMA) |
122.13 |
122.32 |
122.38 |
123.14 |
123.34 |
119.80 |
113.24 |
|
% M/M |
0.4 |
0.0 |
0.0 |
0.6 |
0.2 |
-2.9 |
-5.5 |
|
% Y/Y |
0.1 |
-0.1 |
0.4 |
1.4 |
1.6 |
-1.5 |
-7.3 |
|
CAB |
122.79 |
122.42 |
122.74 |
124.26 |
123.02 |
112.11 |
104.60 |
|
% M/M |
0.5 |
0.4 |
0.3 |
1.2 |
-1.0 |
-8.9 |
-6.7 |
|
% Y/Y |
0.6 |
0.6 |
1.1 |
2.4 |
1.3 |
-8.2 |
-14.8 |
|
*Percentage changes may not reflect index values due to rounding. |
|||||||
The CAB comprises indicators relating to the production of chlorine and other alkalies, pigments, plastic resins, and other selected basic industrial chemicals; chemical company stock data; hours worked in chemicals; publicly sourced, chemical price information; end-user (or customer) industry sales-to-inventories; and several broader leading economic measures (building permits and new orders). Each month, ACC provides a barometer number reflecting activity data for the current month, as well as a three-month moving average. The CAB was developed by the economics department at the American Chemistry Council.
Current-month, unadjusted readings of the CAB are based on high-frequency weekly and daily data. For example, we use equity data as of the Thursday before the release date. Using mid-month data can lead to large revisions if conditions appreciably change in the second half of the month. We have moved the release dates for the CAB to the last Tuesday of the month. We hope this will minimize the revisions.
For the full data set, please click here. The next CAB is planned for May 26, 2020 at 9:10 AM EST.


